
Designing Interactive Network Visualization for Enterprise Infrastructure
Helping IT administrators explore, understand, and troubleshoot complex network environments through familiar interaction patterns, progressive disclosure, and intuitive visualization experiences.
Product
Extreme Platform One
Role
Sr. Product Designer
Team
3 Designers • 50+ Cross-functional Team
Duration
2+ years
Platform
Web/ Desktop


Overview
Extreme Platform ONE (EP1) unified multiple networking products into a single enterprise platform. One of its core experiences was an interactive Network Visualization that enabled network administrators to explore relationships between physical infrastructure, network fabrics, and services while troubleshooting complex enterprise environments.
My role
As a Senior Product Designer, I designed key user experiences and interaction patterns for the Network Visualization experience within Extreme Platform ONE, including multi-layer visualization, enterprise navigation, topology exploration, and monitoring and troubleshooting workflows. I translated complex network concepts into intuitive user experiences by creating high-fidelity designs and interactive prototypes while collaborating closely with Product Management, engineers, and fellow designers to help network administrators confidently navigate and understand complex enterprise networks.
- Information Architecture
- Interaction Design
- Enterprise Network Visualization
- High-Fidelity UI Design
- Interactive Prototyping
- Cross-functional Collaboration
the challenge
How do we make enterprise network visualization intuitive enough that administrators can confidently explore, understand, and troubleshoot complex infrastructures?
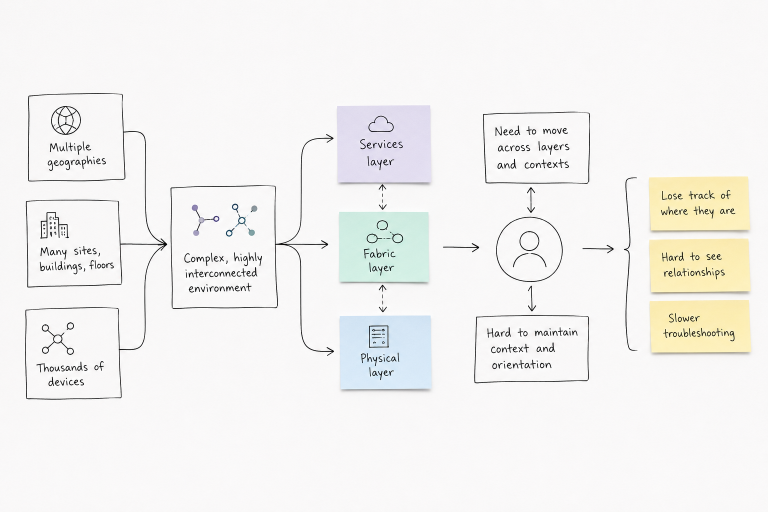
Enterprise networks can span thousands of interconnected devices distributed across multiple locations and technologies. Administrators must move between geographic locations and the Physical, Fabric, and Services layers while maintaining context throughout their investigation.
My goal was to design an interactive visualization experience that made this complexity easier to explore, understand, and troubleshoot.
design process
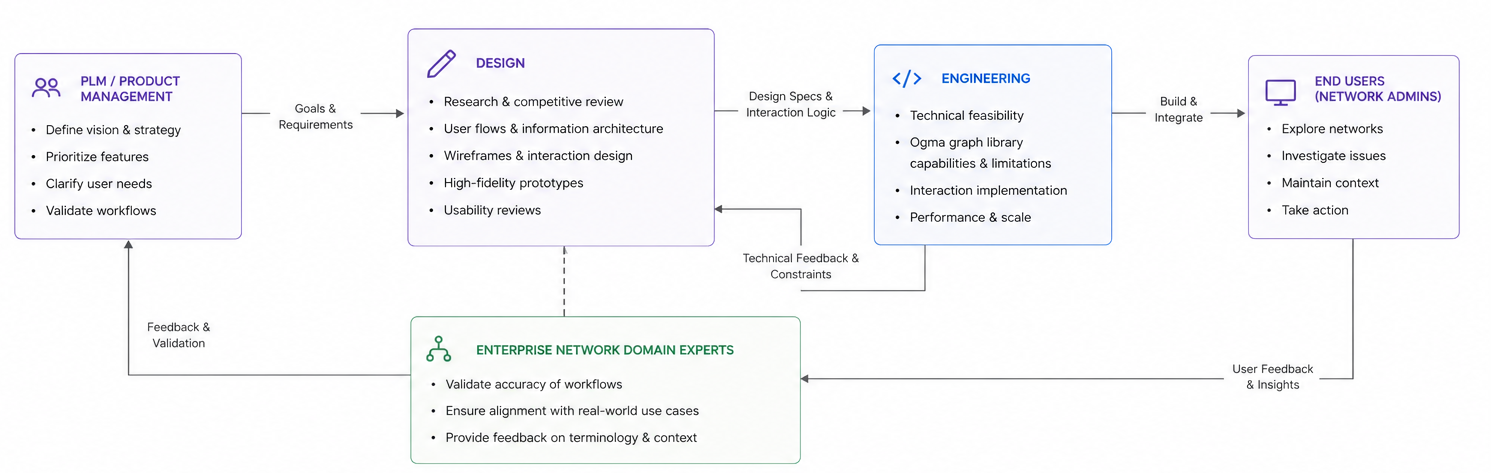
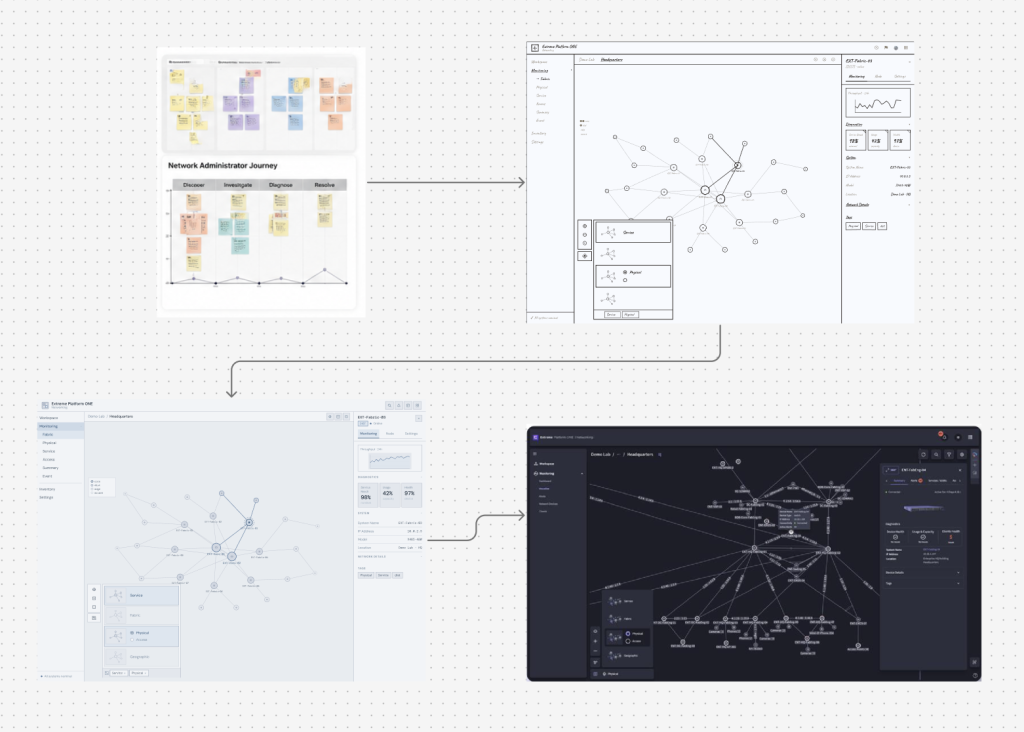
Designing for a complex enterprise platform required an iterative and collaborative approach rather than a linear sequence of steps. I explored ideas through sketches and wireframes while continuously refining the information architecture and interaction patterns through collaboration with Product Management, Engineering, and design reviews. Throughout the process, I researched enterprise networking products and familiar interaction patterns from everyday applications, applying proven mental models where they could reduce cognitive load and help network administrators navigate complex systems more intuitively.
Rather than inventing new interaction patterns, I looked for familiar mental models that could make complex enterprise workflows more intuitive.
Core Design Decisions
Designing a Multi-Layer Network Visualization


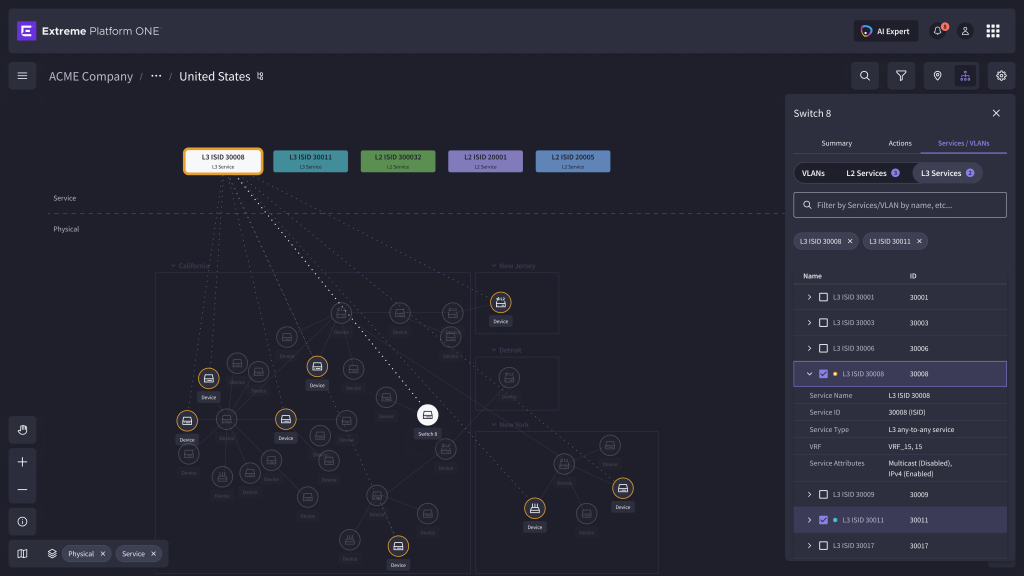
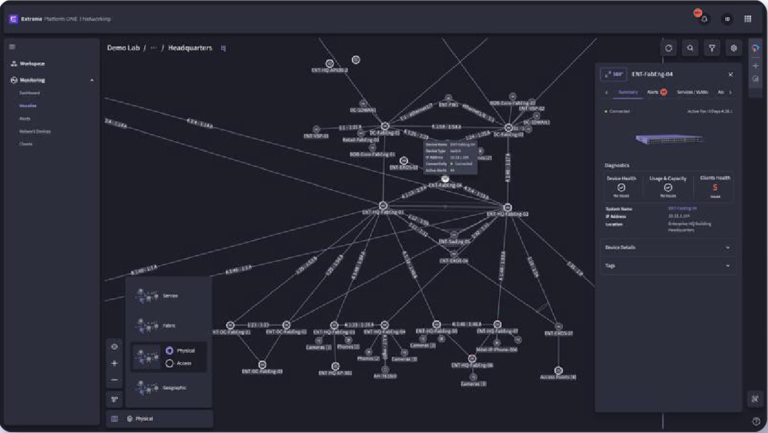
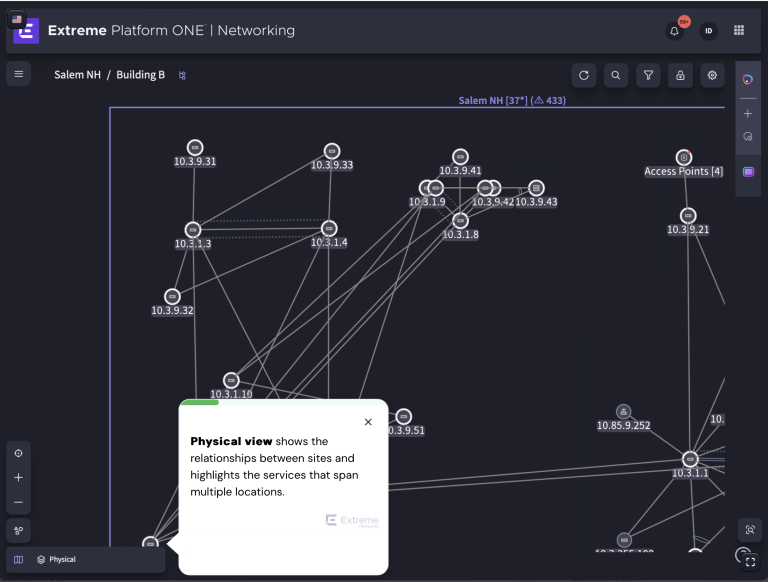
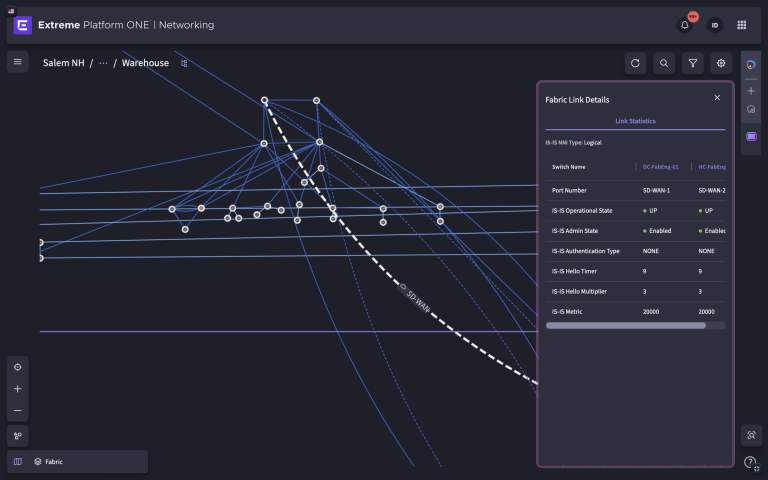
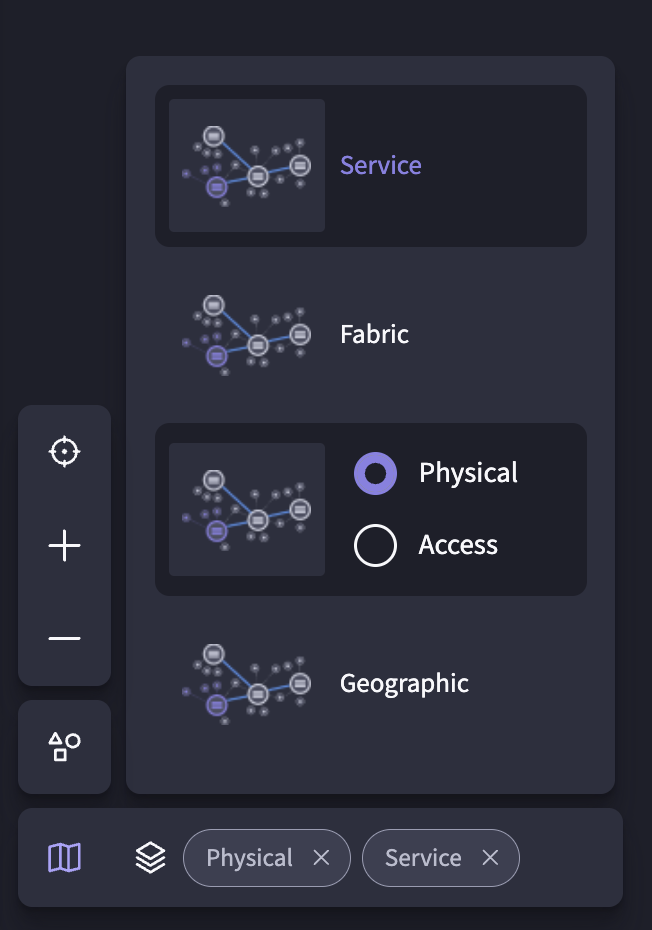
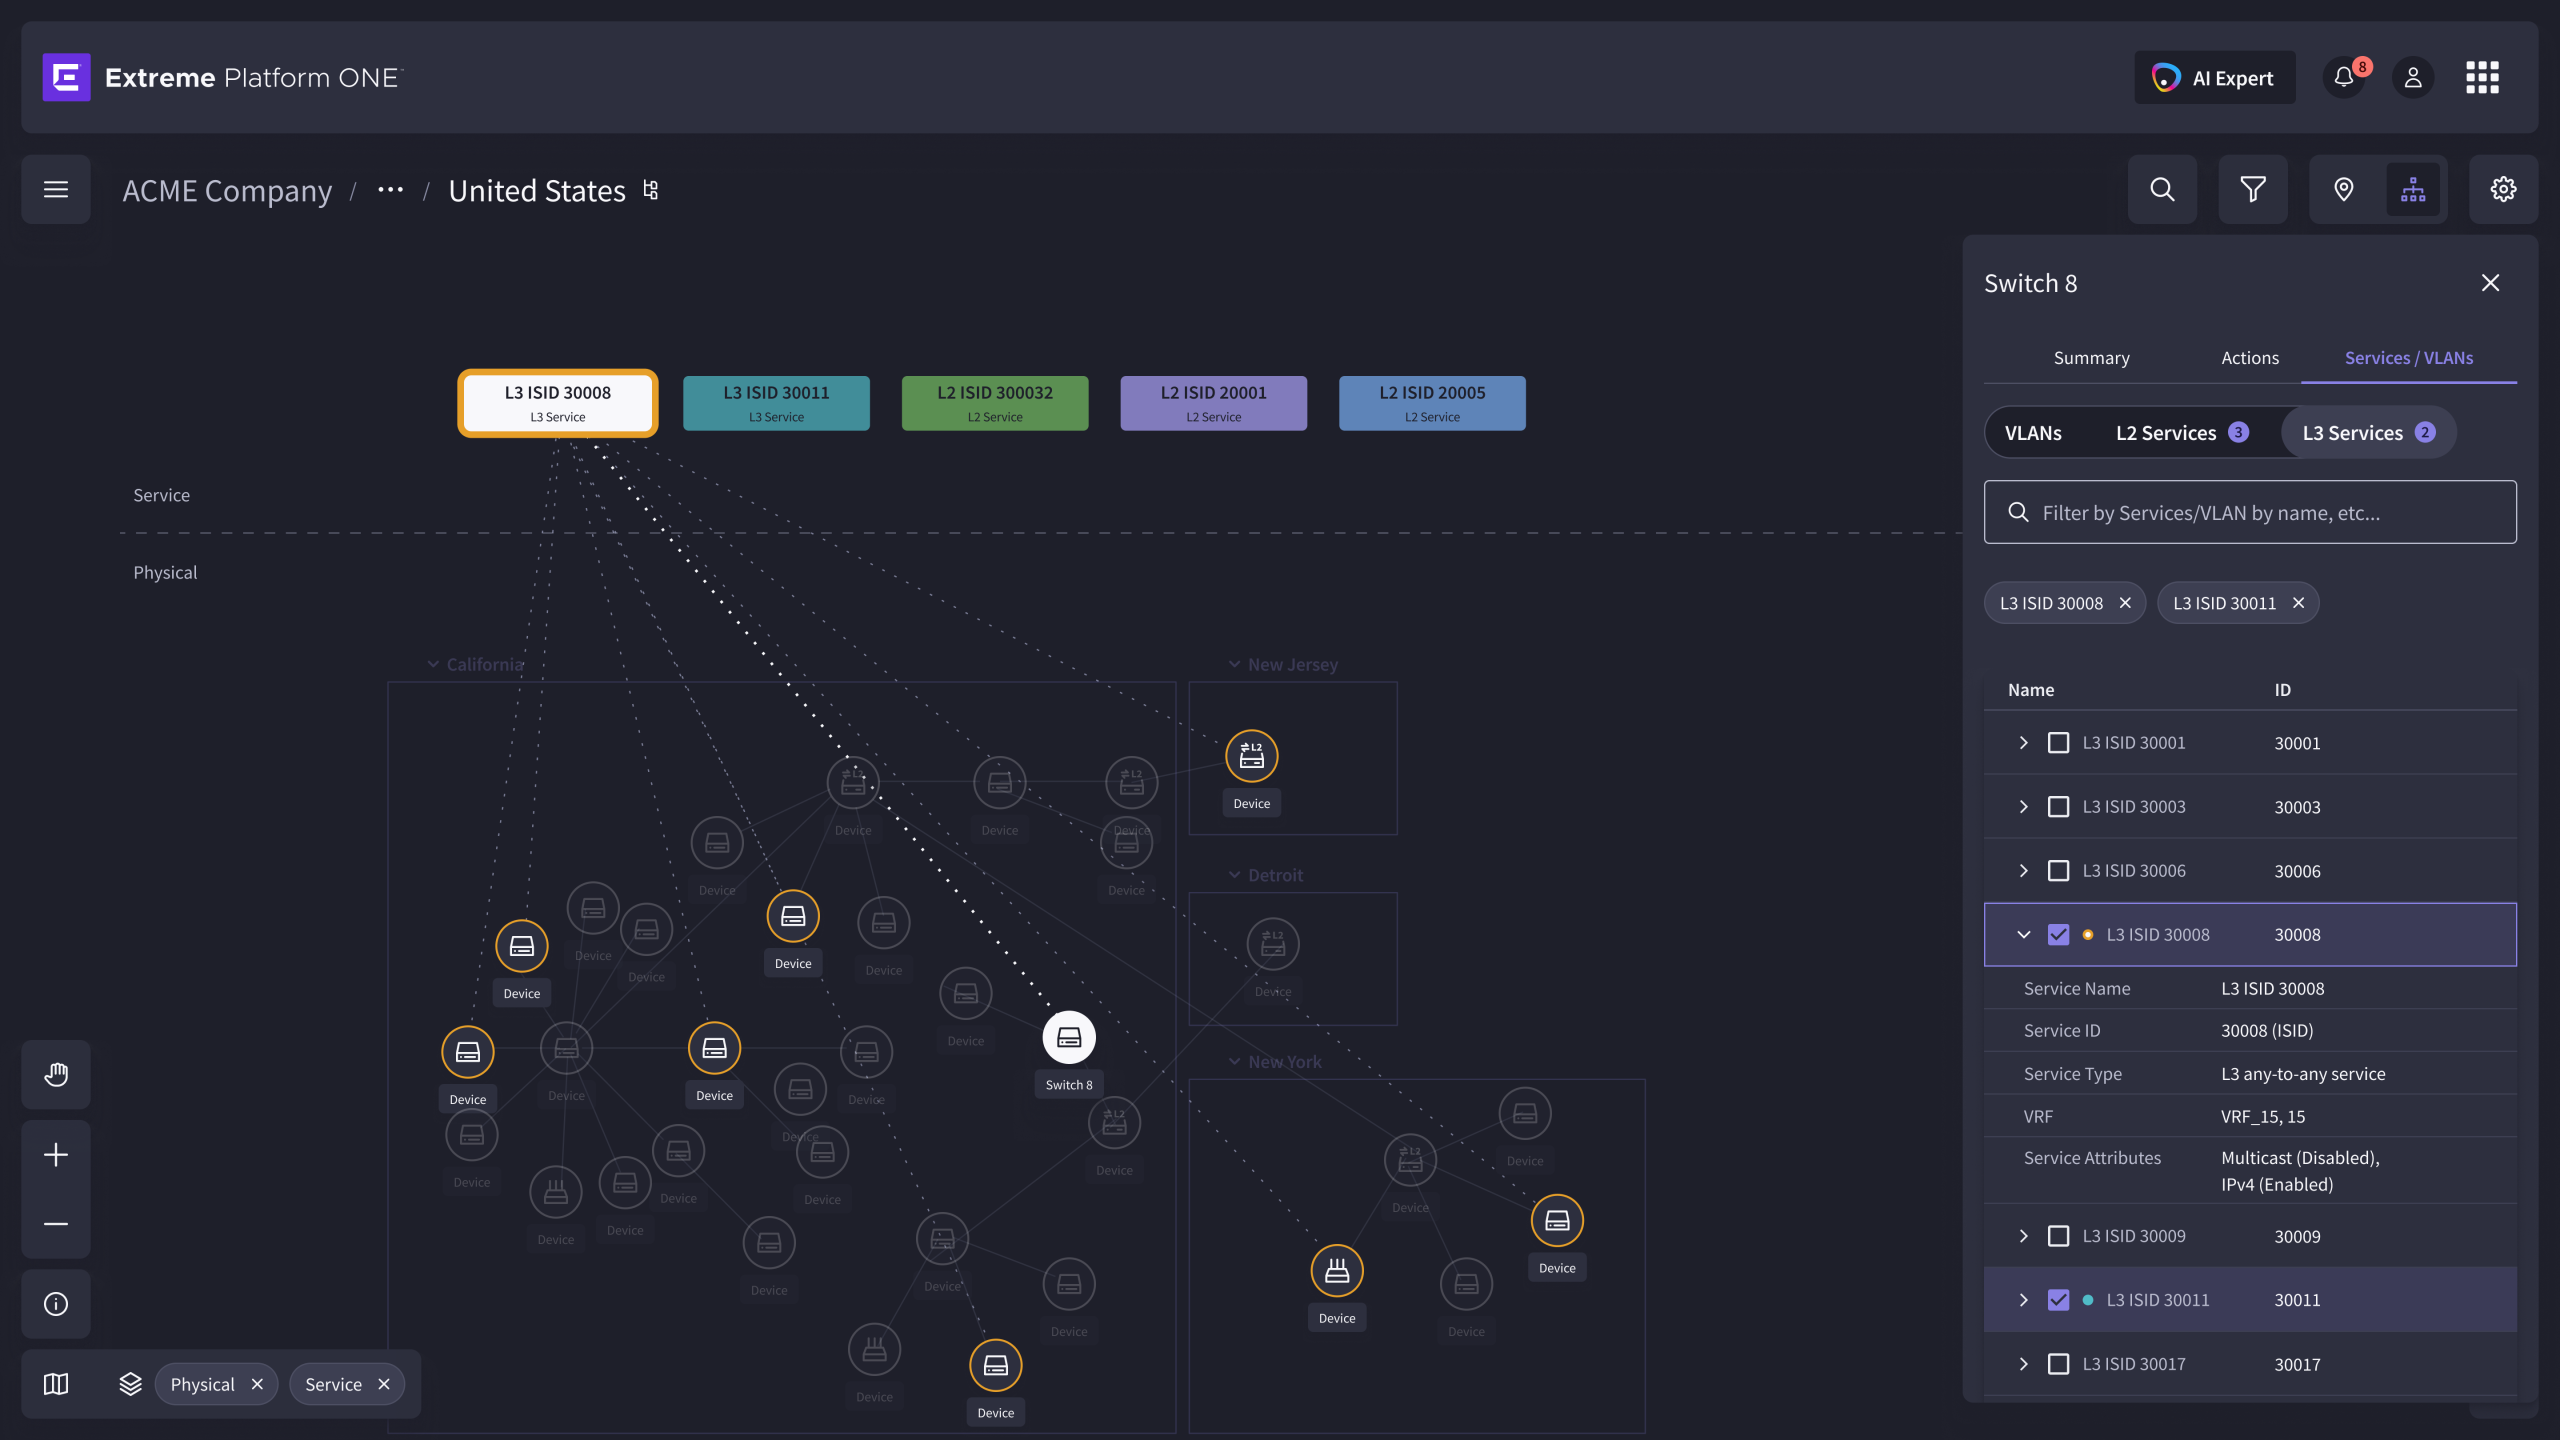
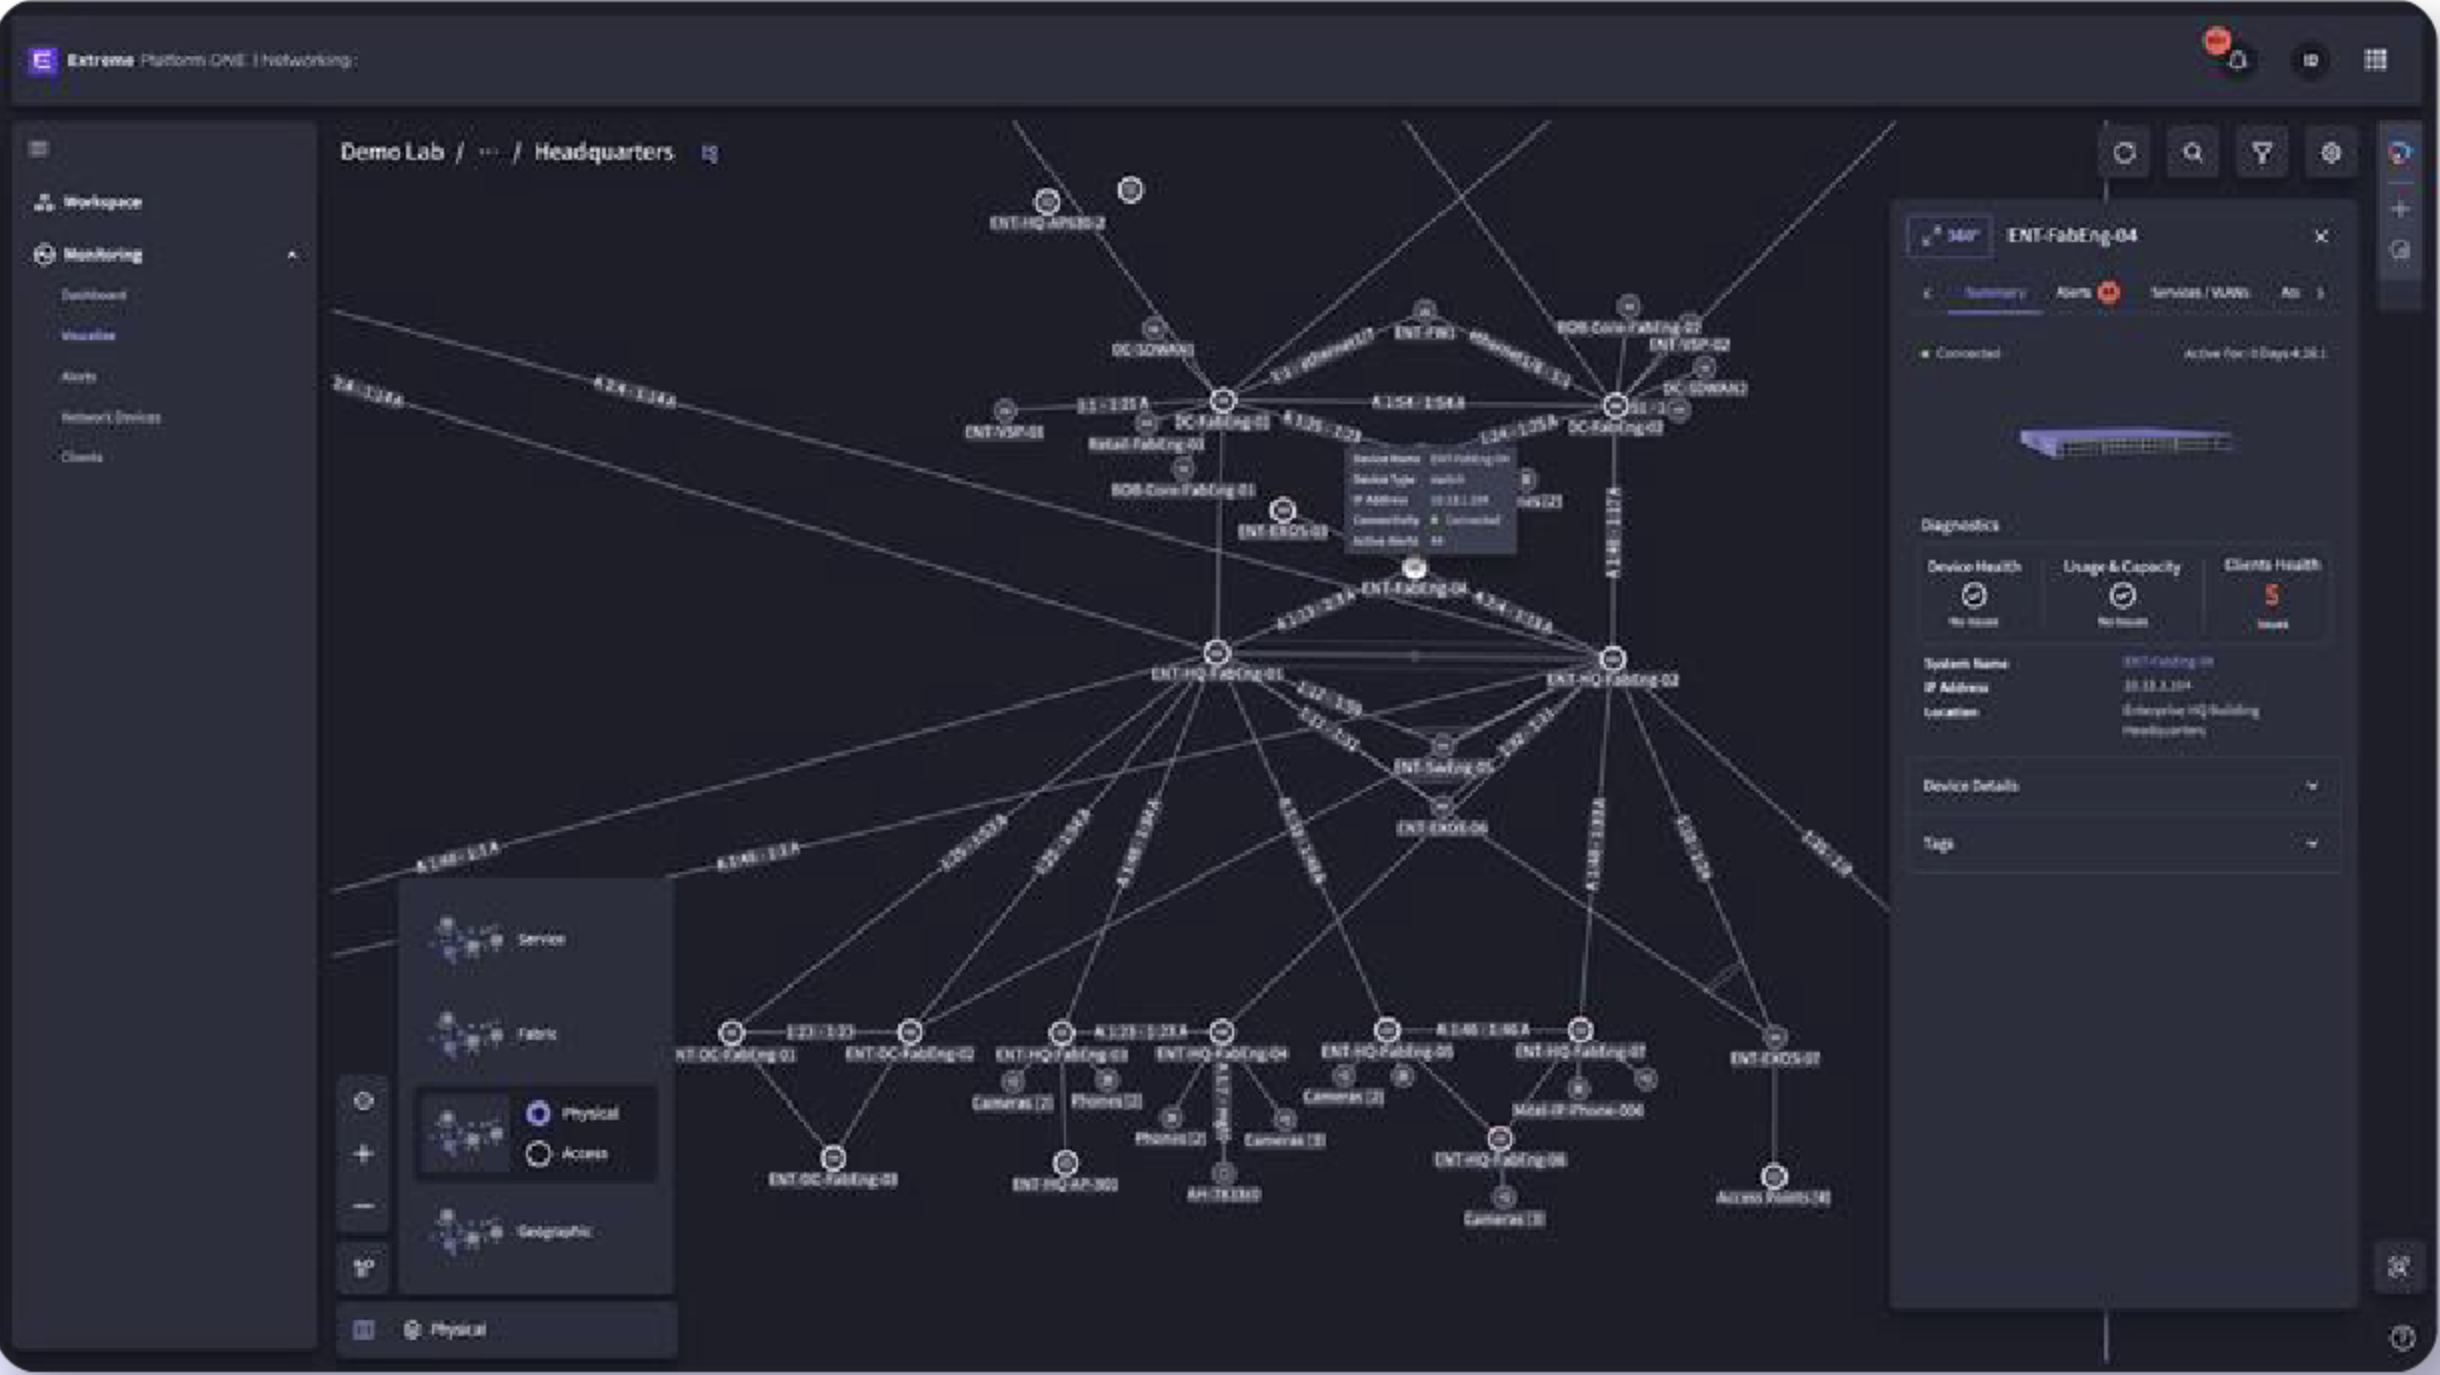
Enterprise networks can be viewed through multiple interconnected layers, each providing unique insights into the network’s behavior. Administrators needed a seamless way to transition between the Physical, Fabric, and Services layers while maintaining context during their investigation.
How do we help administrators understand the same network from multiple perspectives while preserving context?
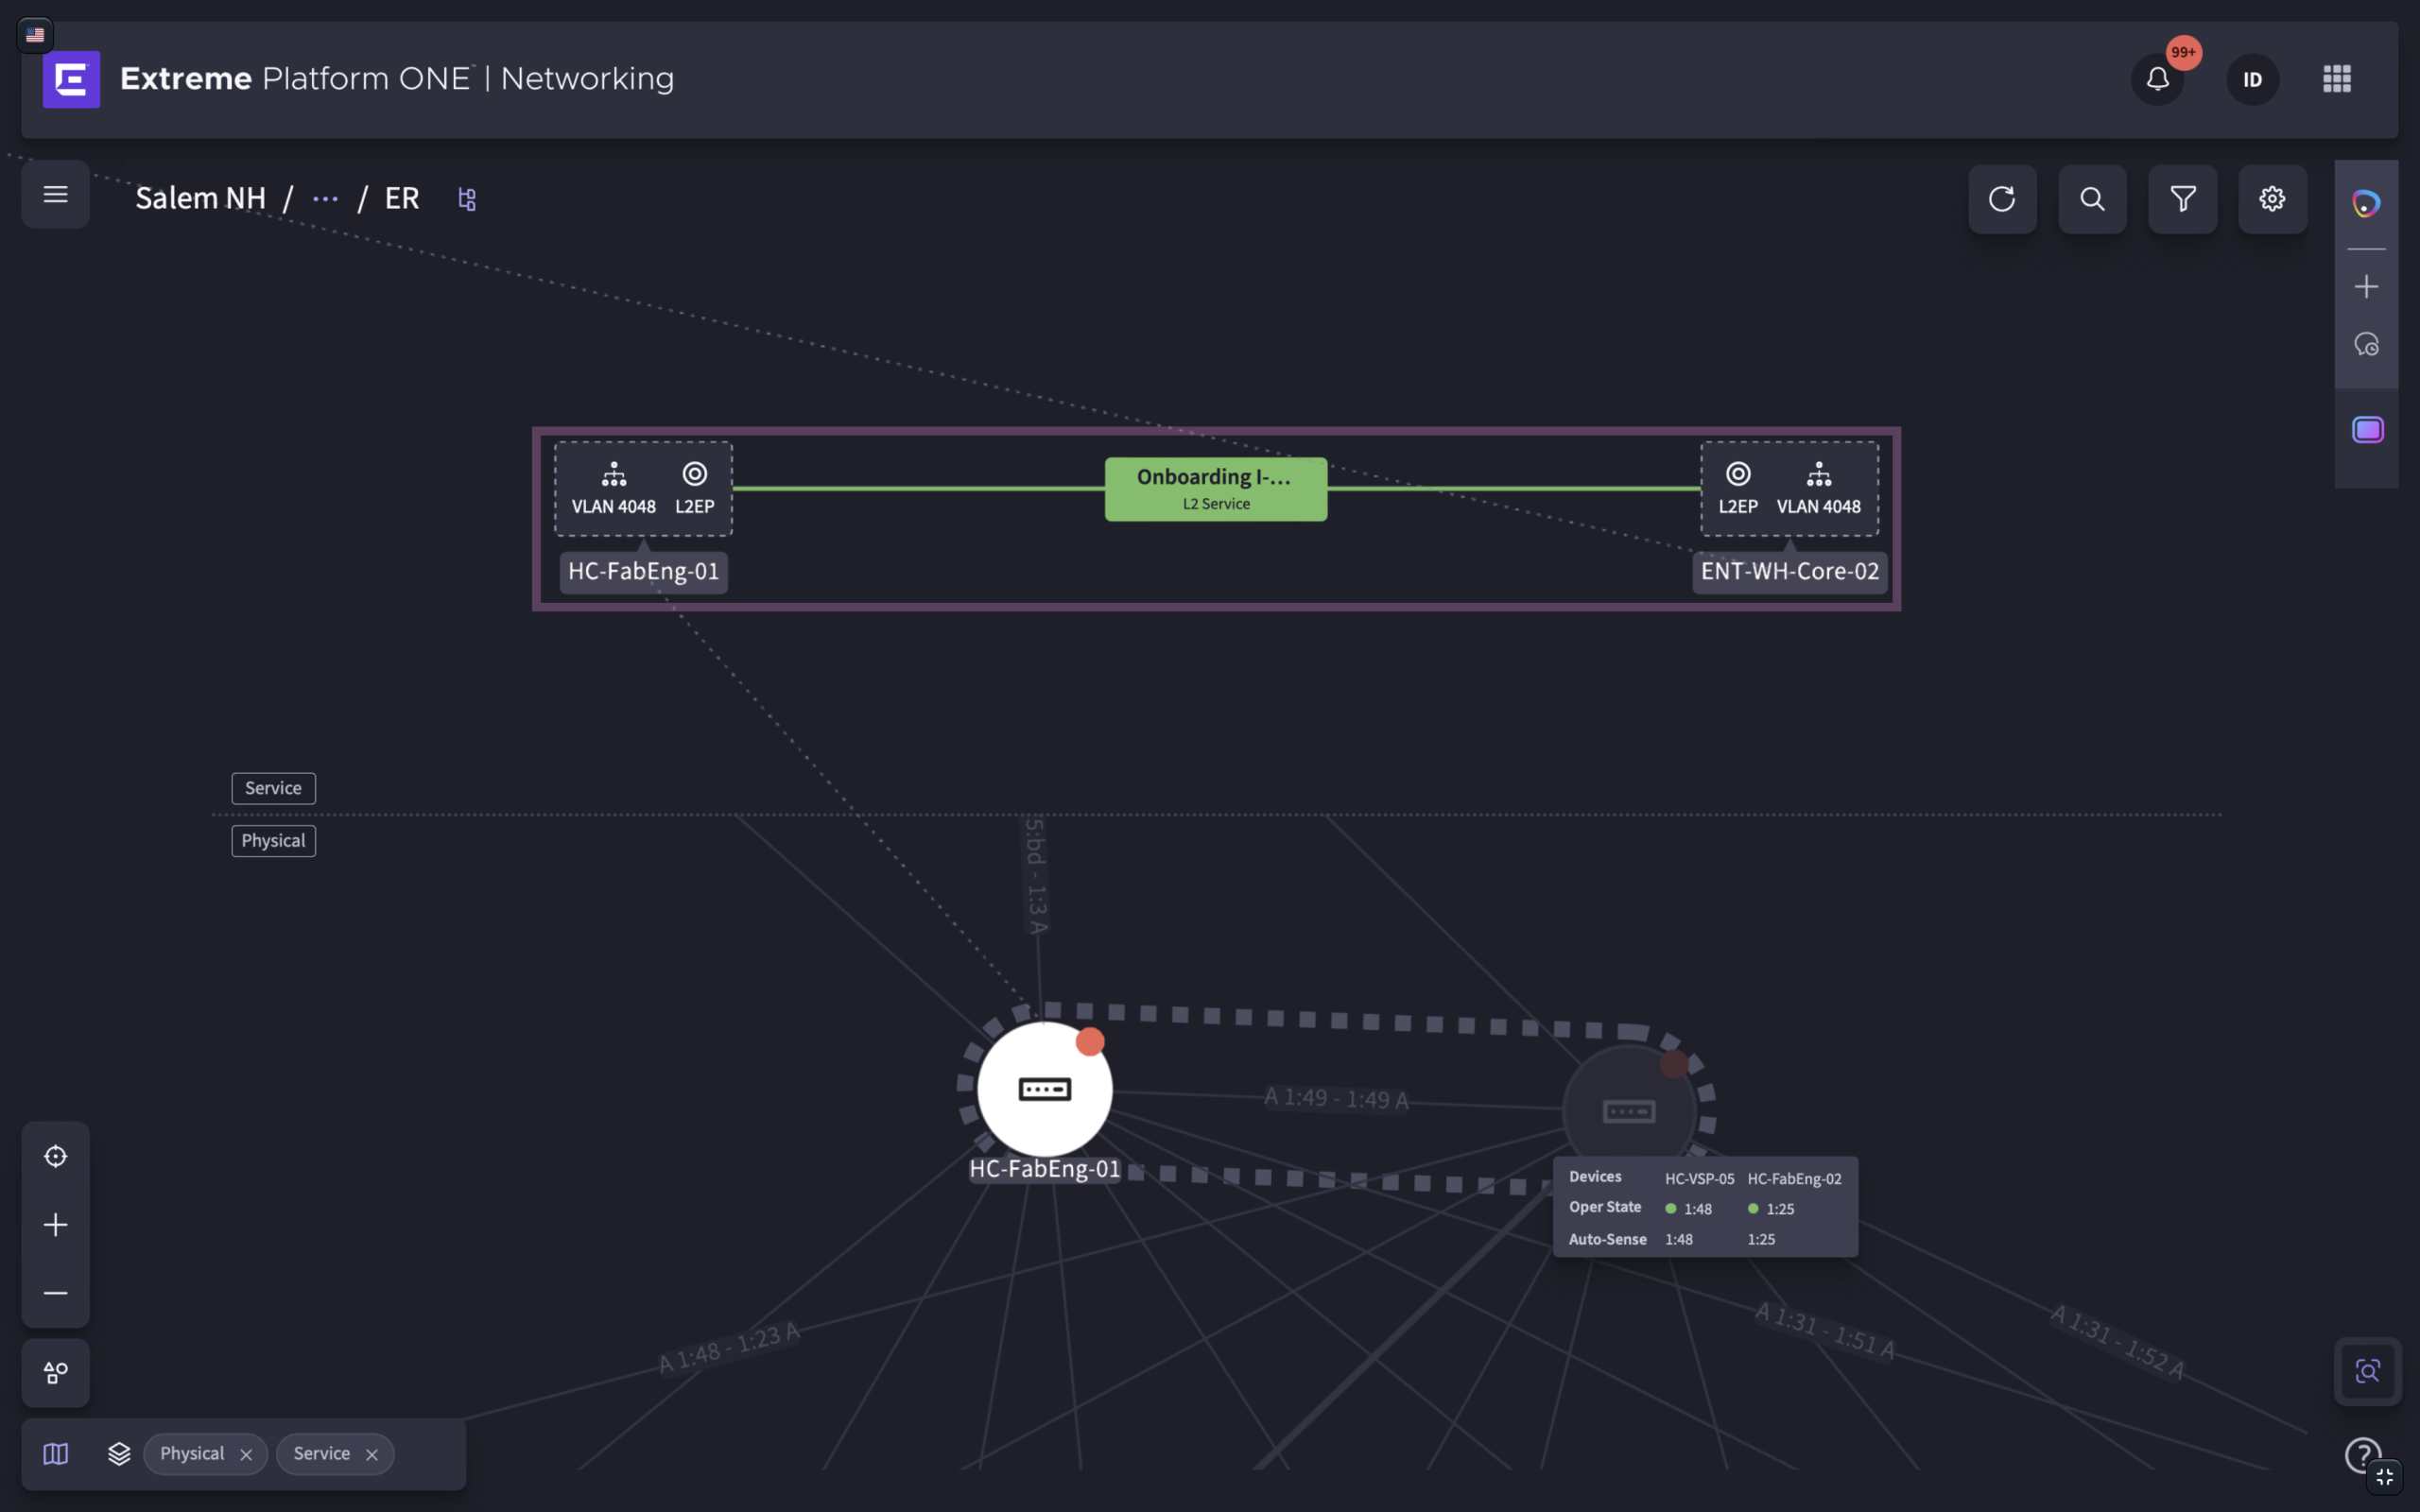
I designed the interaction model for navigating between these layers, allowing users to switch perspectives or compare two layers side by side using a split-view experience. This helped administrators understand how changes or issues in one layer related to another without losing their place in the investigation.
Designing Navigation at Enterprise Scale


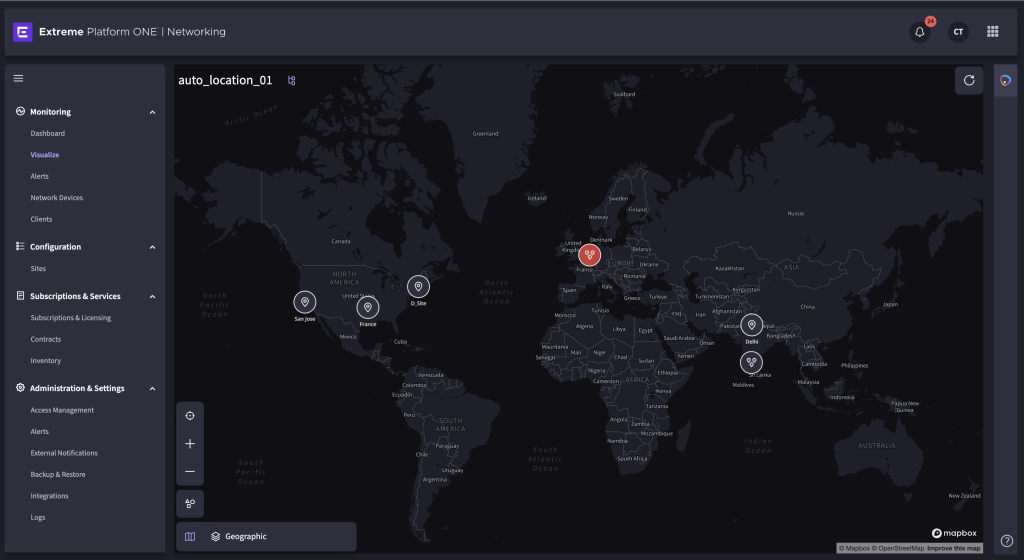
Enterprise customers often manage hundreds of sites distributed across multiple regions.
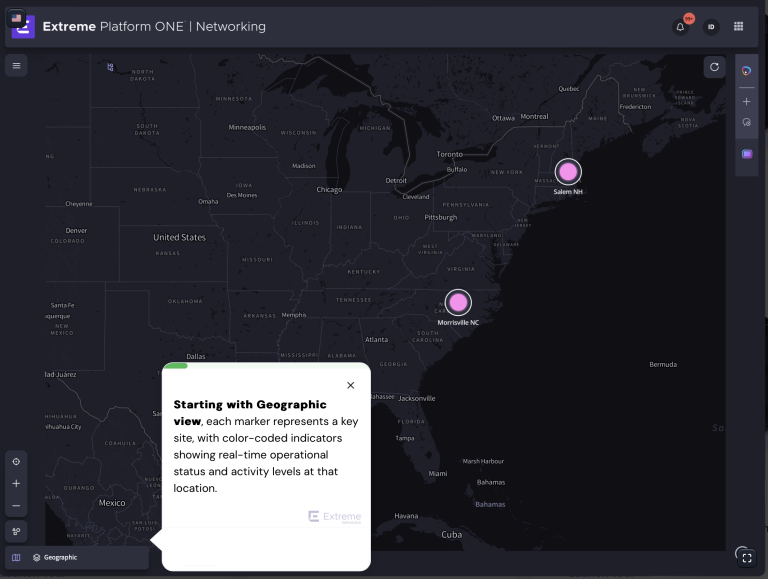
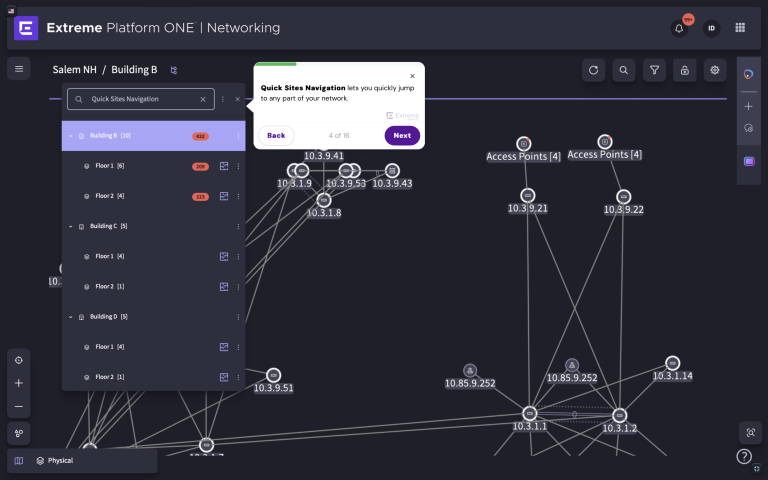
How do we help administrators navigate enterprise networks that span multiple regions, sites, buildings, and floors without losing their sense of place?
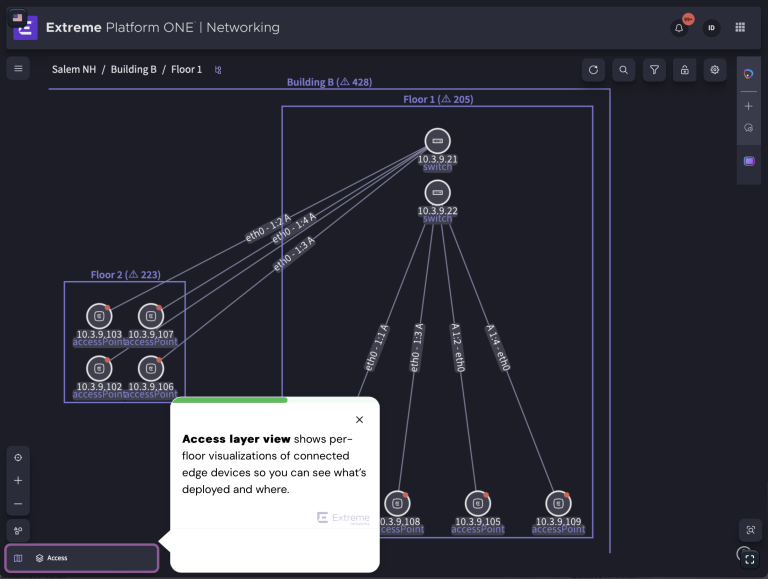
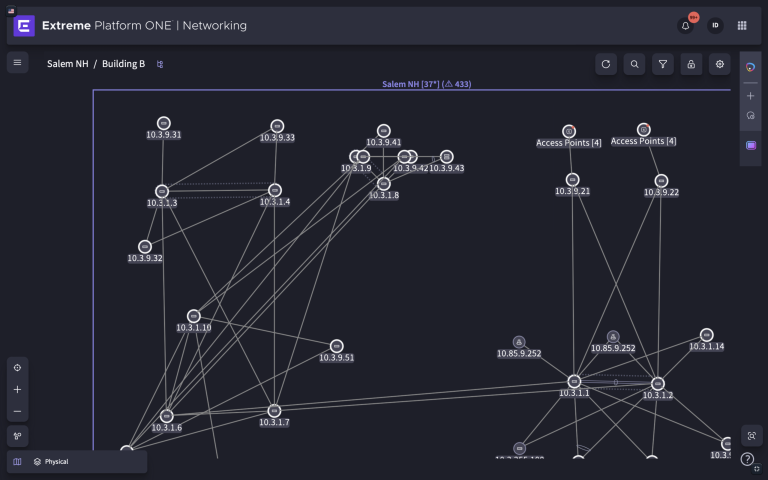
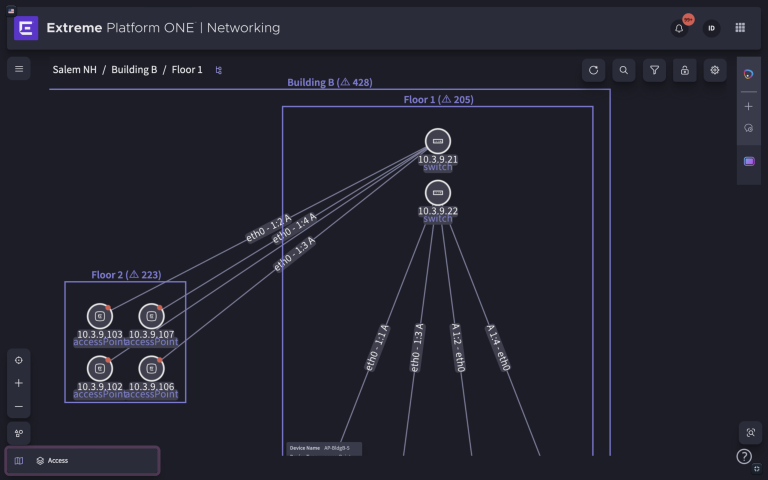
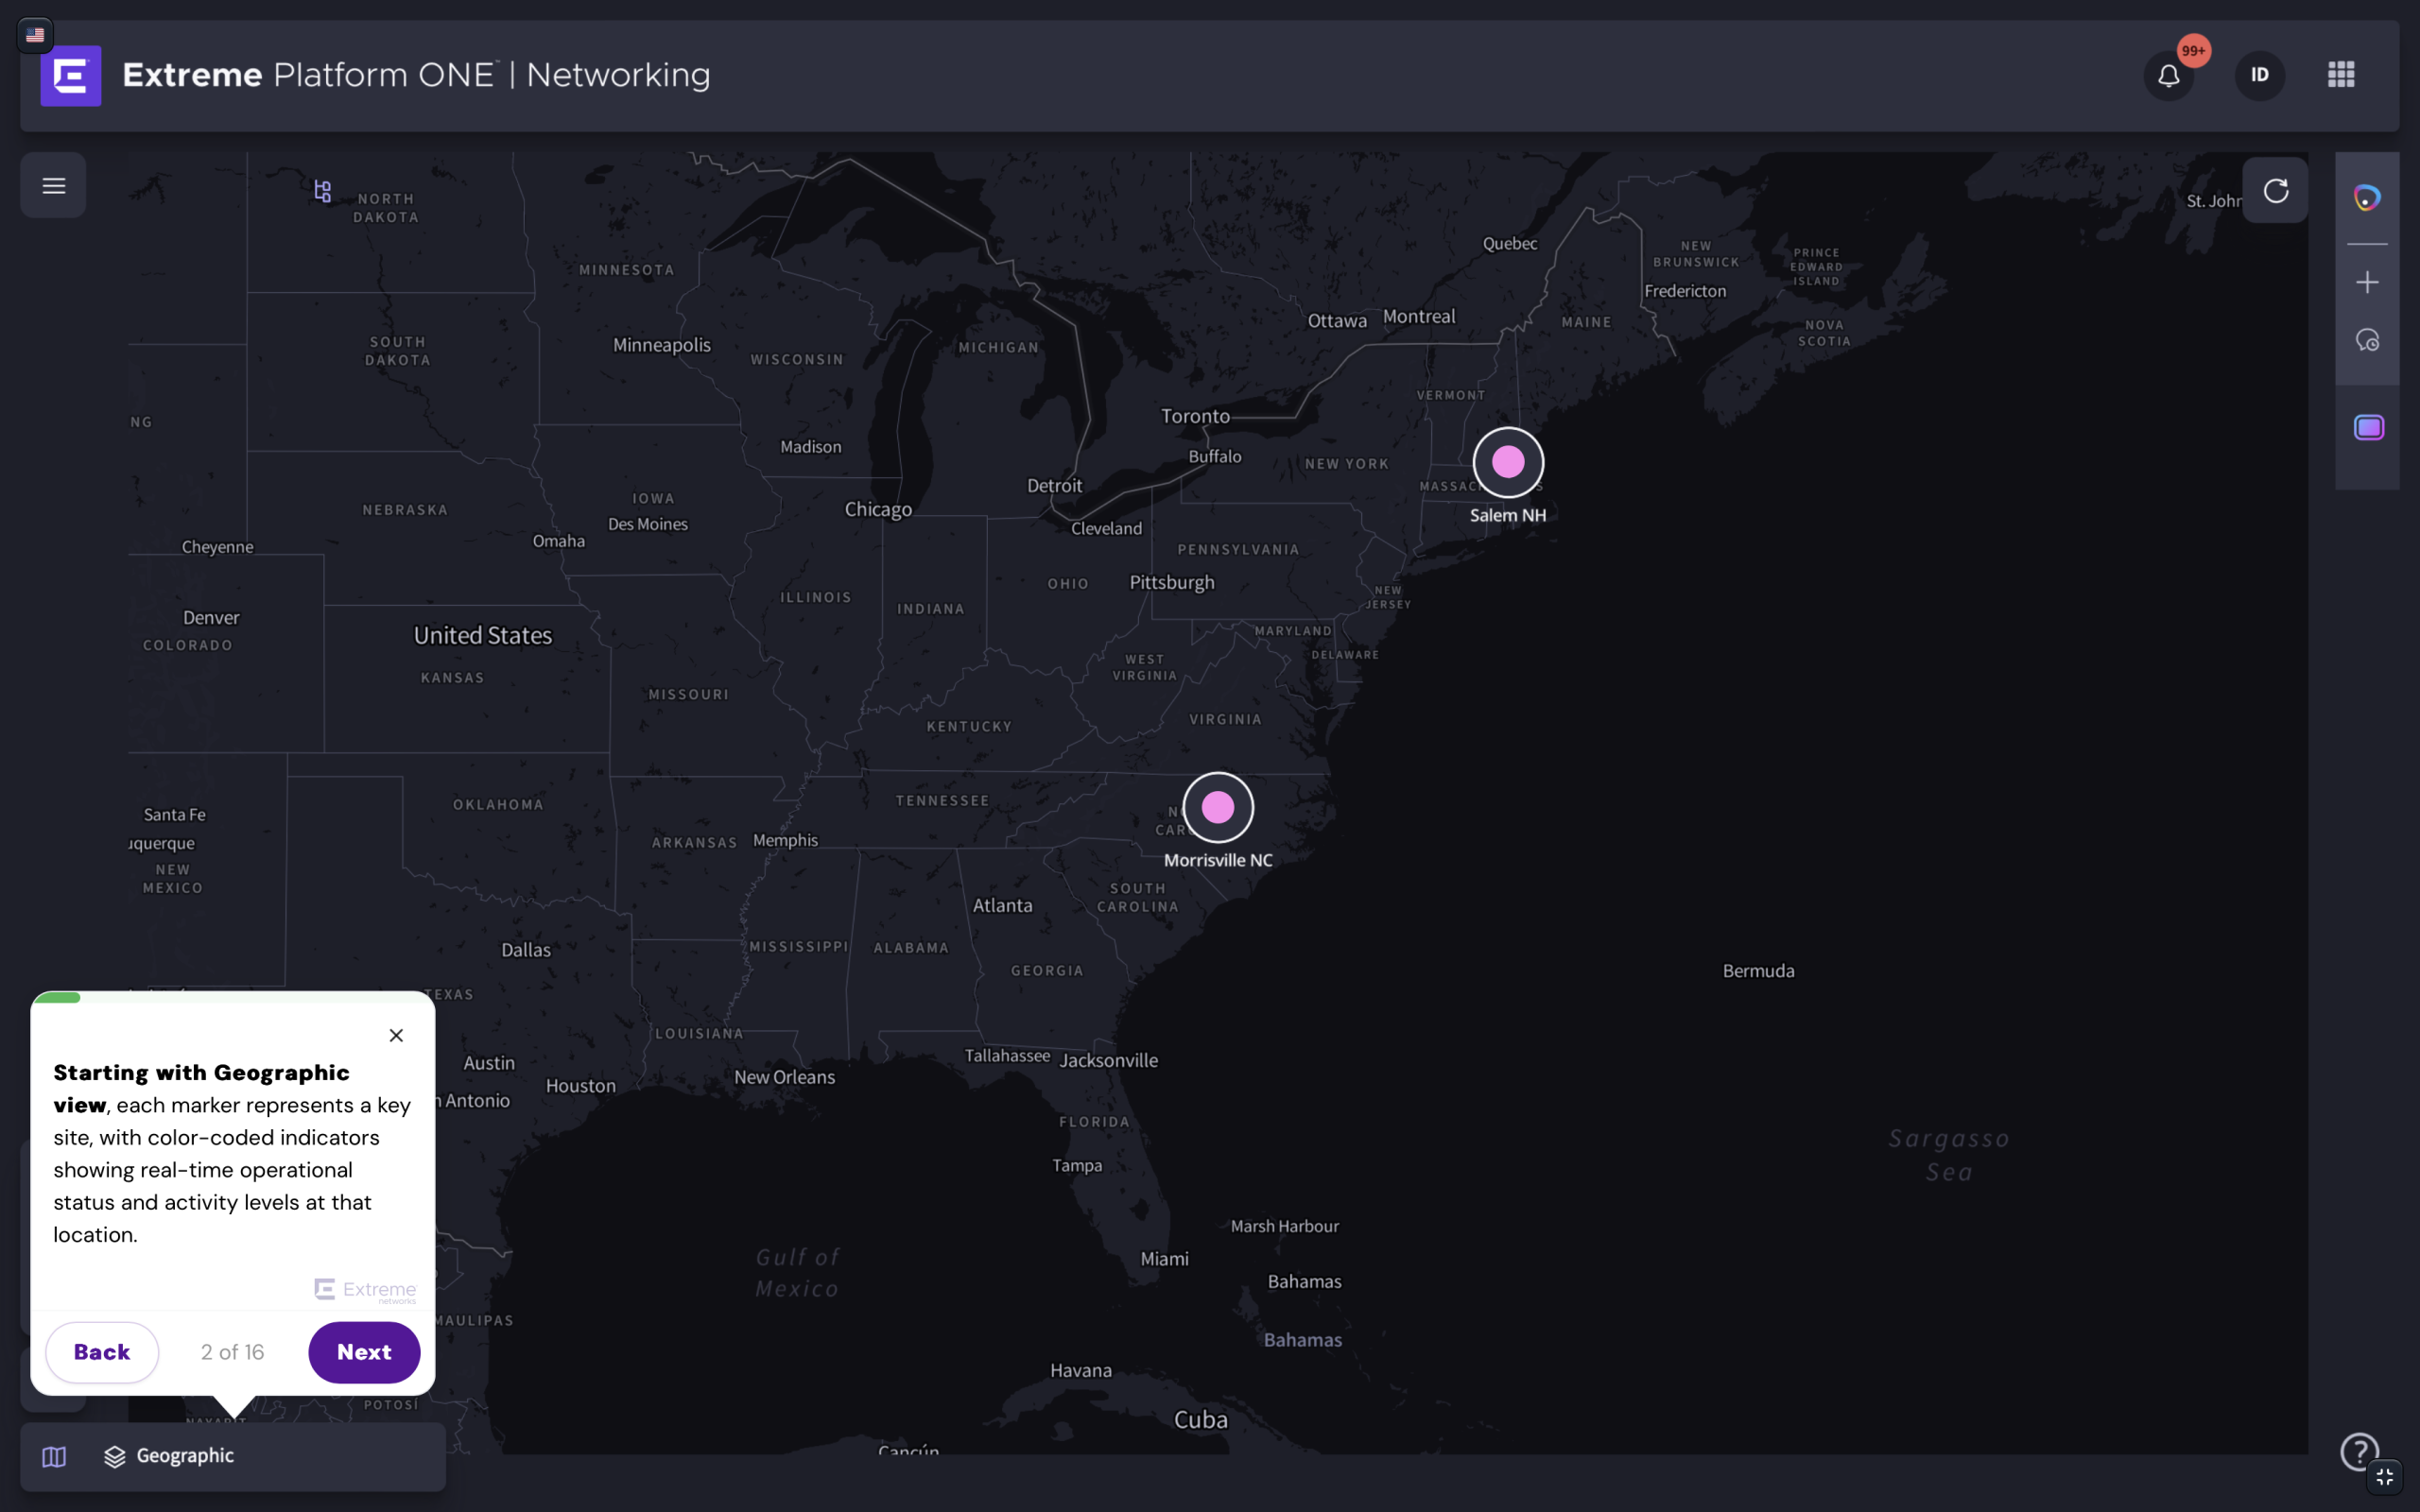
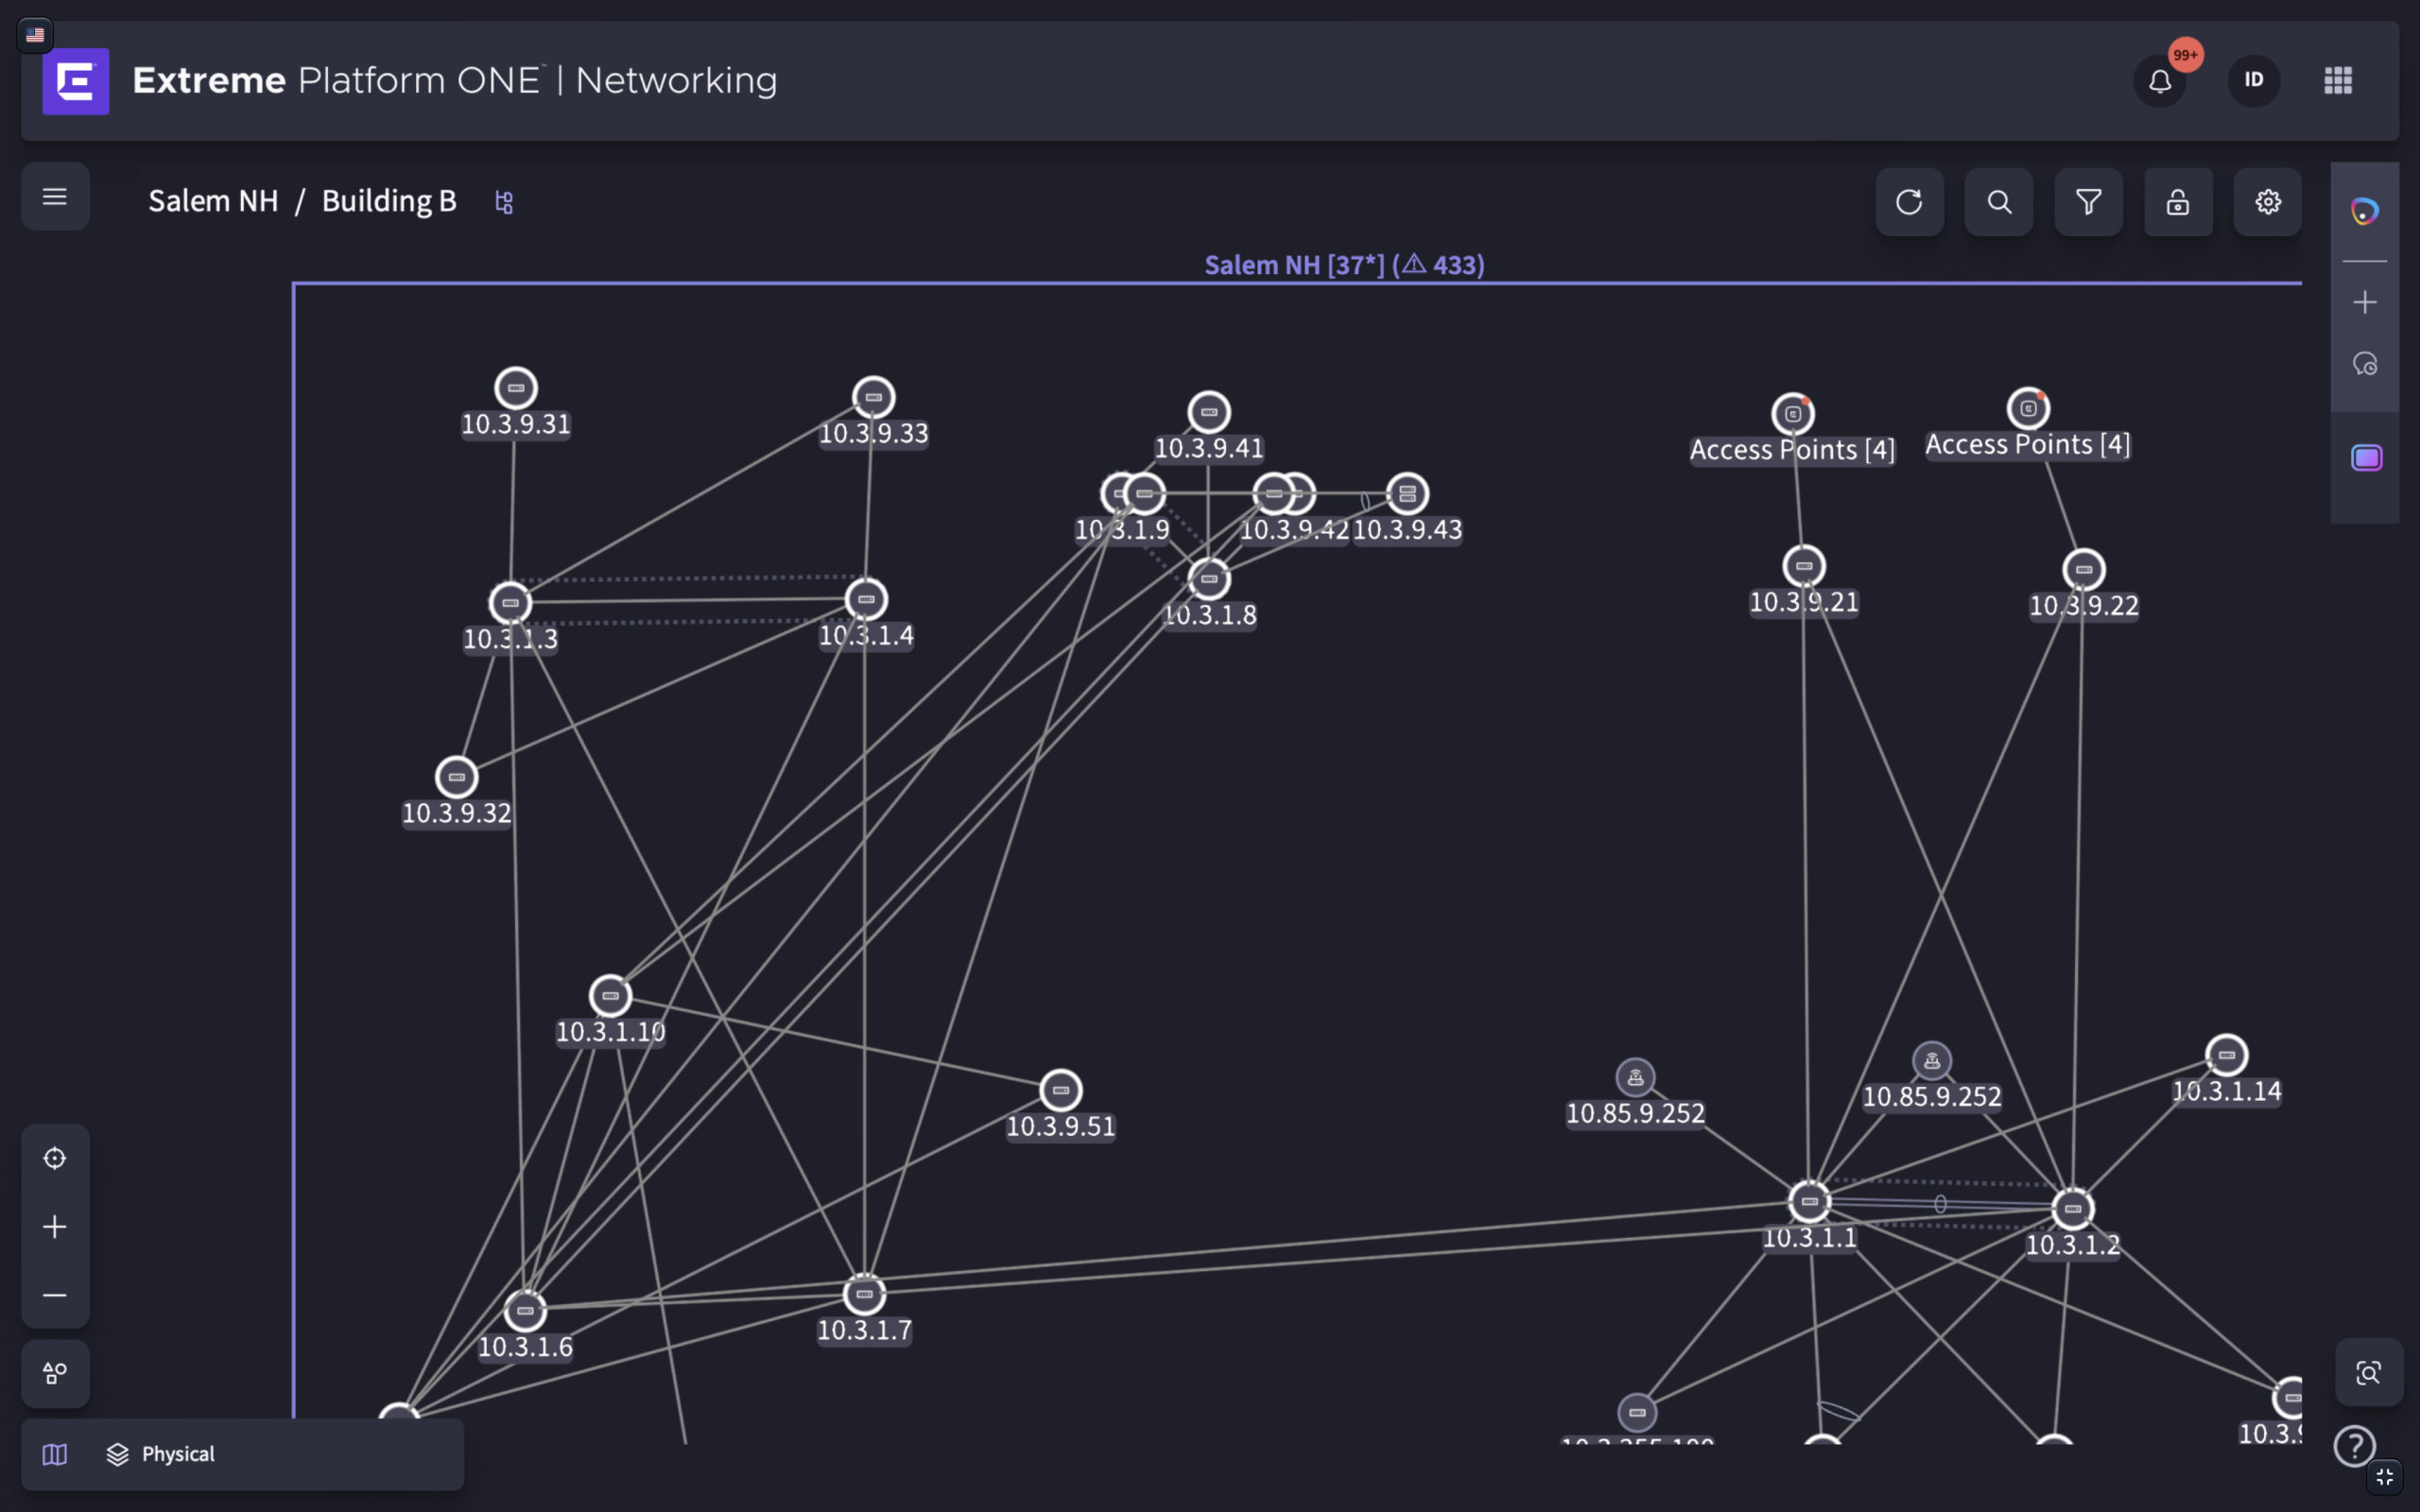
I designed a hierarchical site navigation that mirrored how enterprise networks are organized. Administrators could navigate from a high-level country view through site groups, sites, buildings, and floors, with each level presenting an abstract representation of that part of the network. This allowed users to progressively narrow their focus before entering the detailed topology for investigation.
Progressive Disclosure Through Topology Exploration


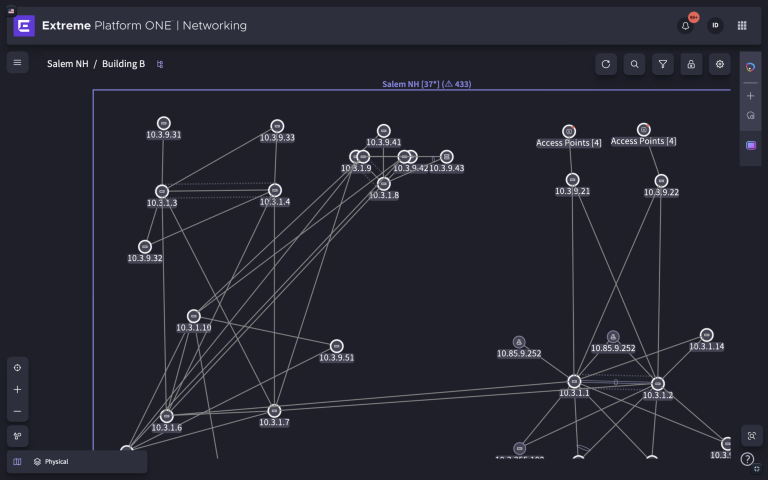
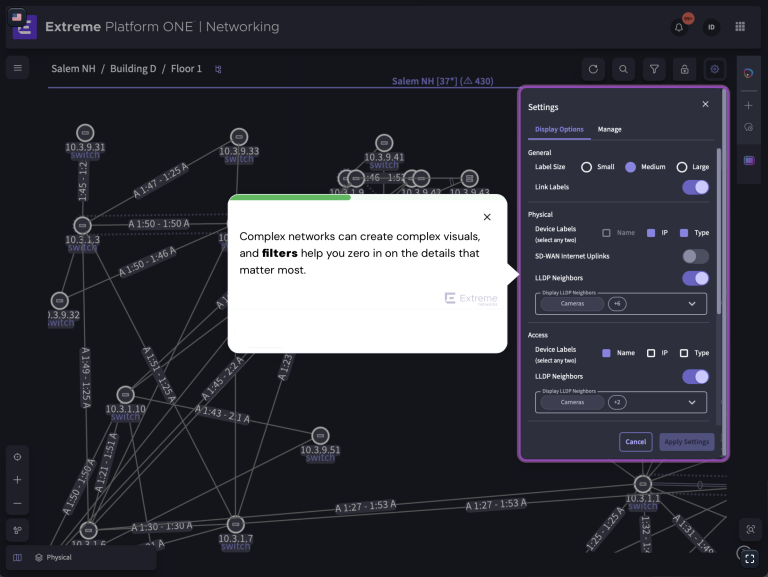
Displaying every device, label, and relationship simultaneously would overwhelm users.
How do we help administrators explore complex network topologies without overwhelming them?
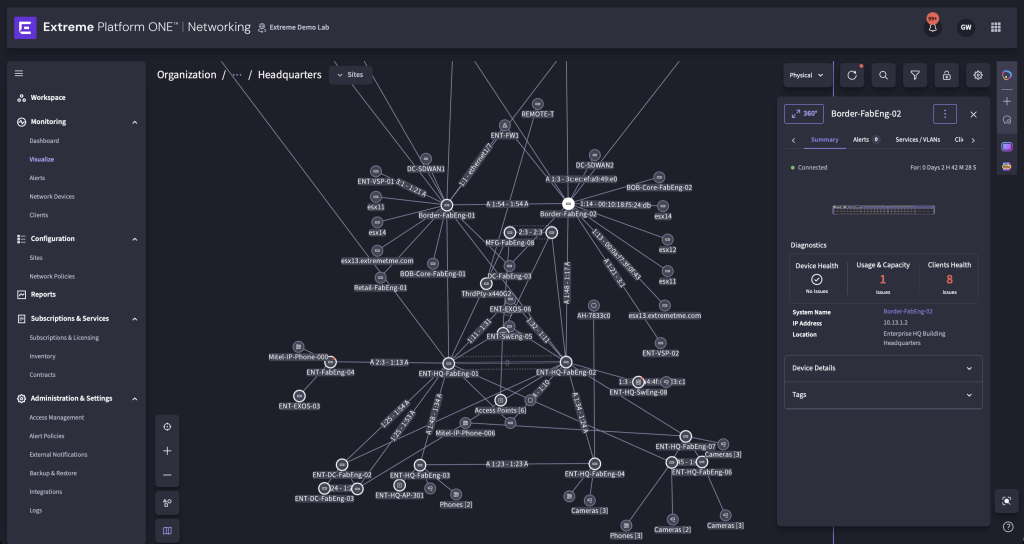
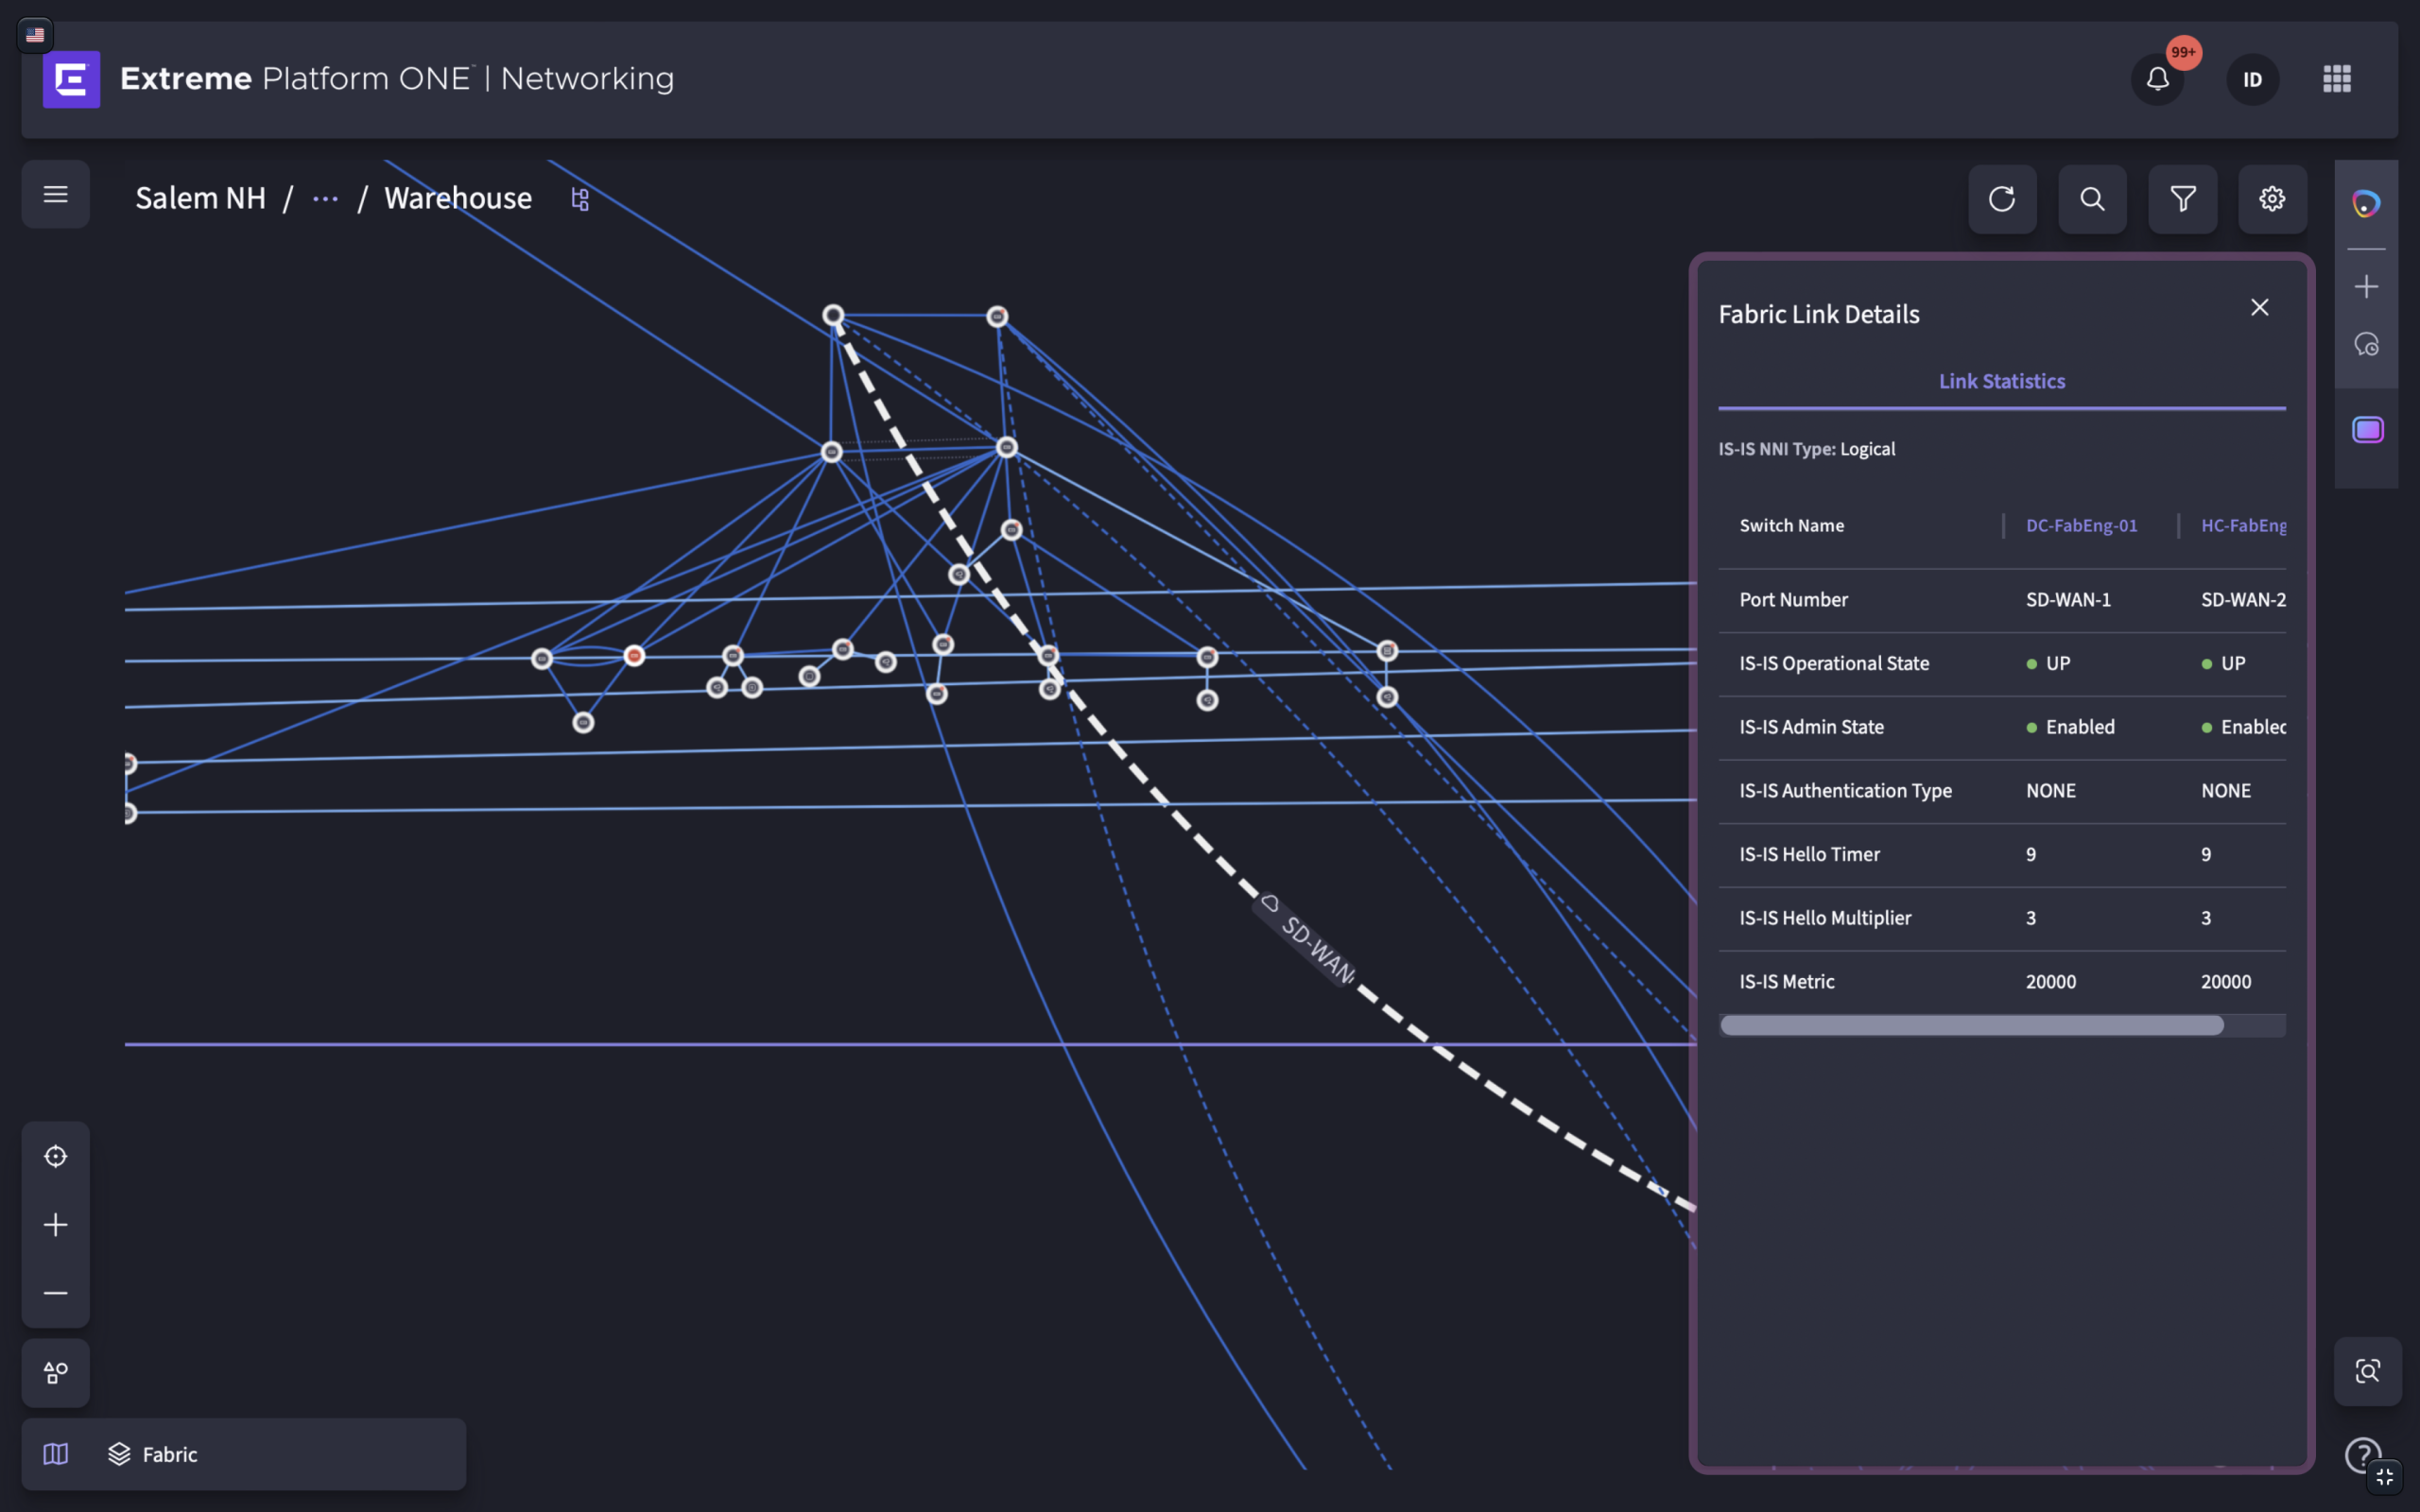
I designed a progressive disclosure model where information appeared gradually as users zoomed into the visualization. This allowed administrators to maintain a clear understanding of the overall network while accessing richer details only when needed.
Supporting Device Investigation Without Losing Context


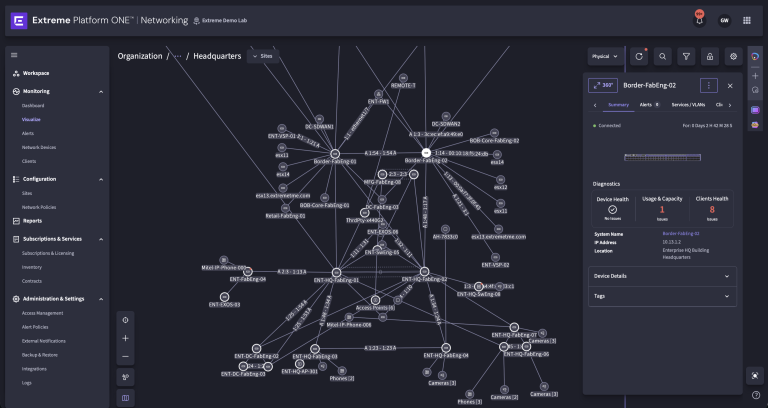
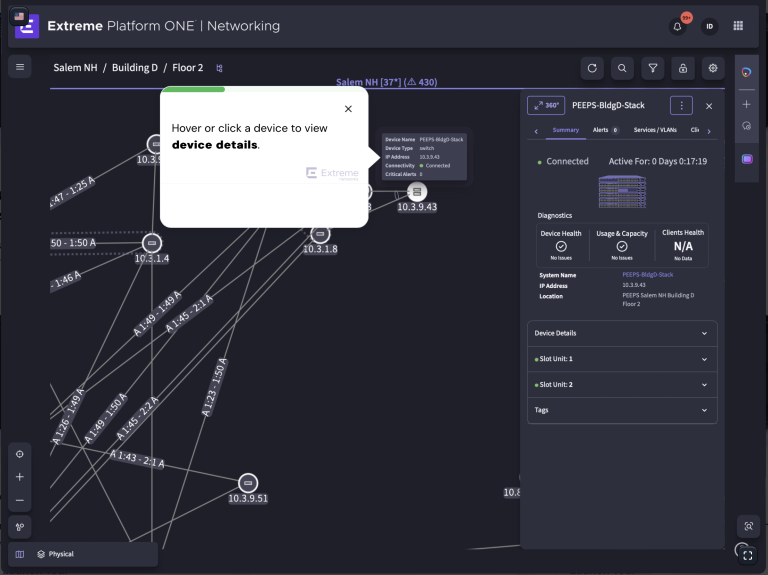
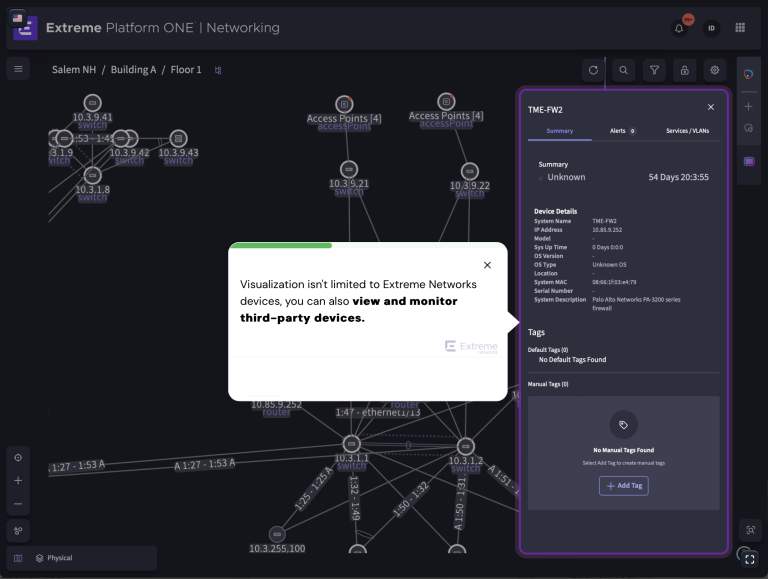
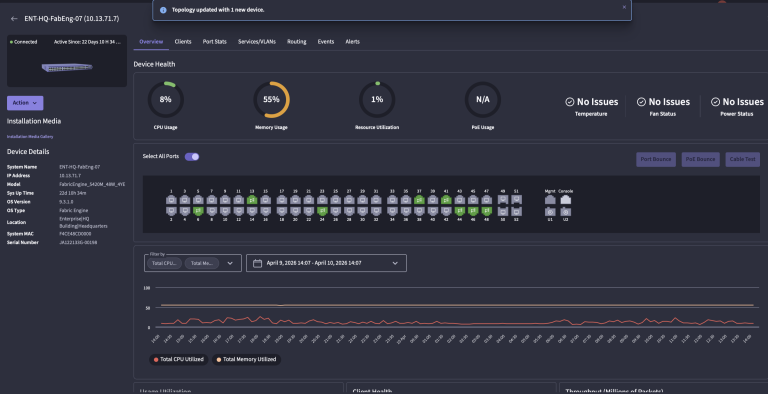
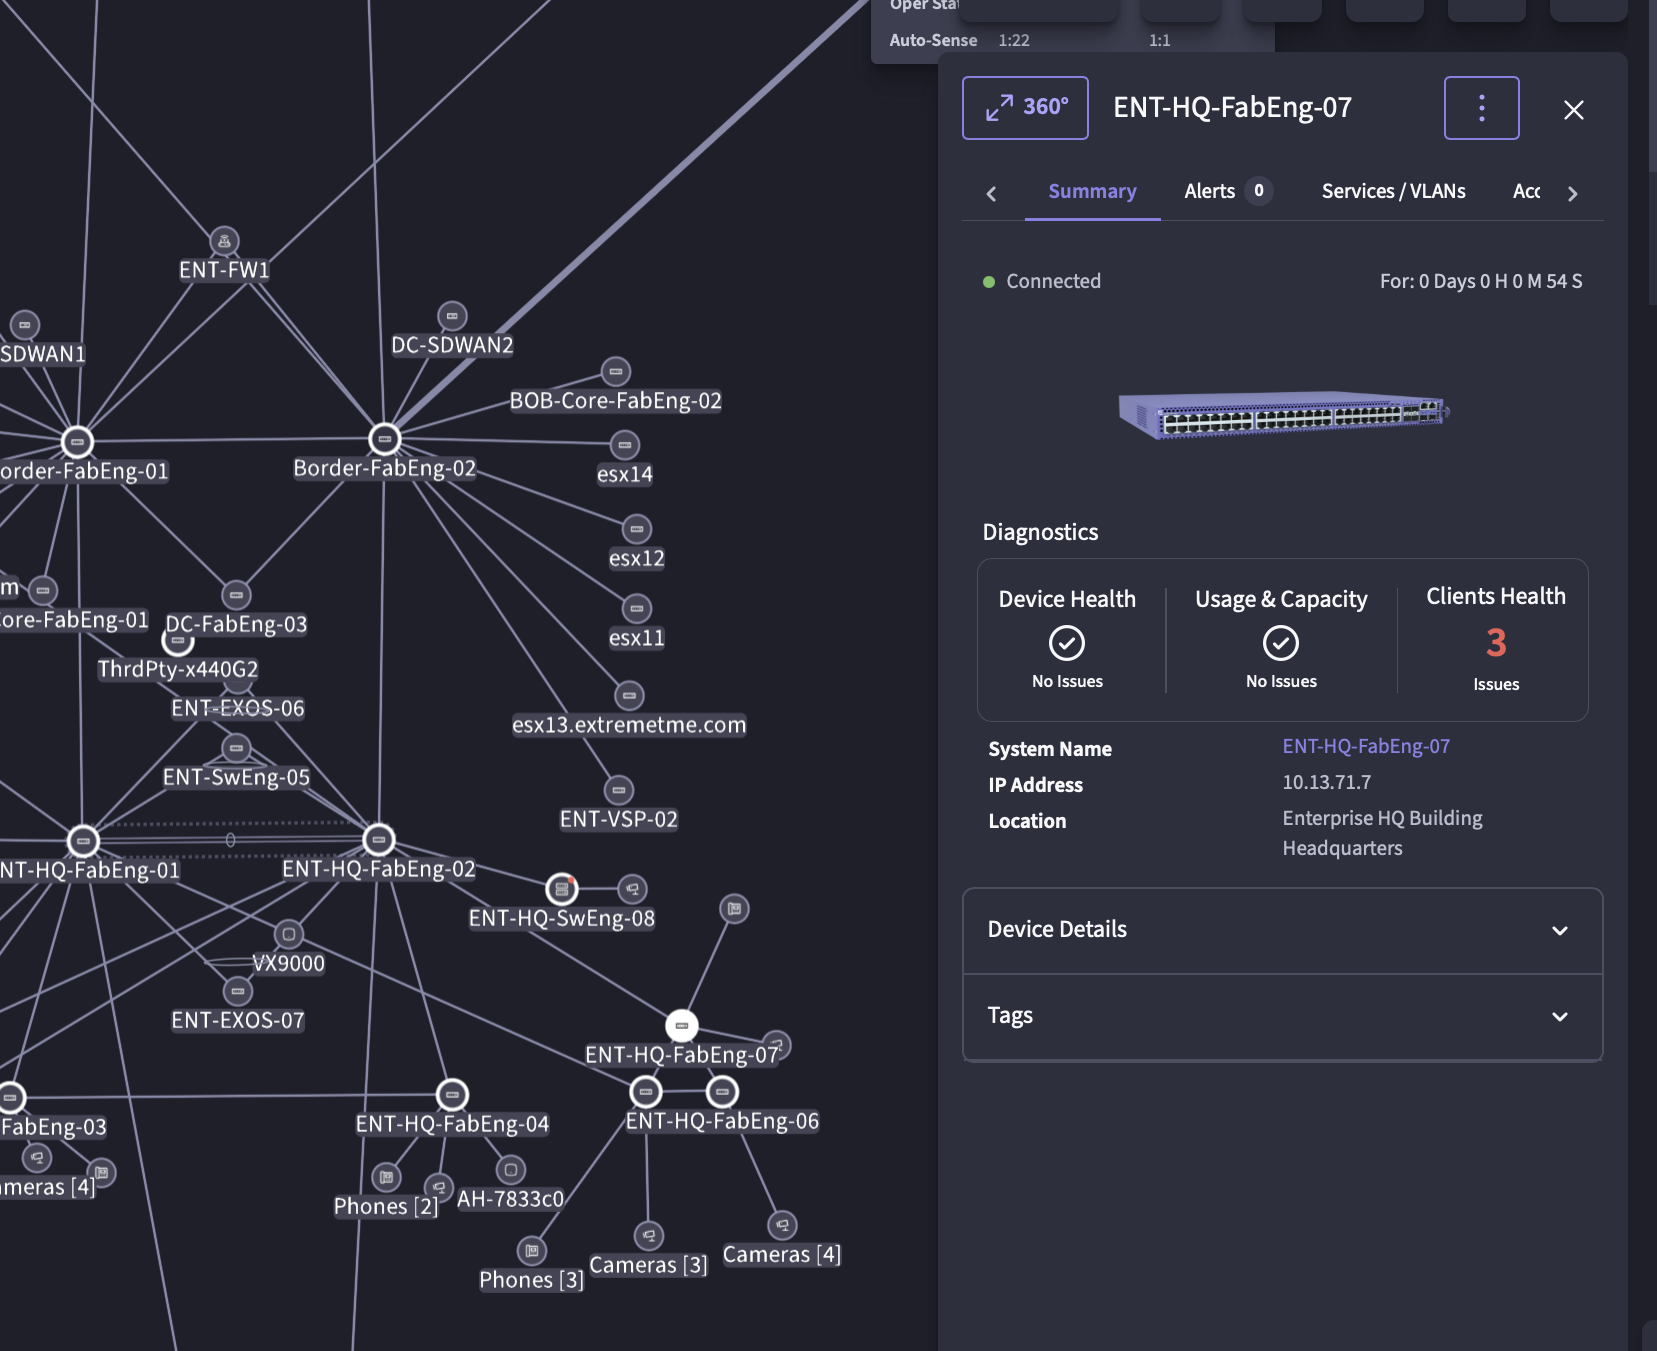
Selecting a device was only the beginning of the investigation. Administrators needed immediate access to critical information such as device health, CPU utilization, memory usage, active alerts, and configuration details without leaving the network visualization.
How do we help administrators quickly investigate a device without disrupting their workflow?
I designed the Inspector as a contextual panel that surfaced the most relevant device information while keeping the topology visible. When deeper analysis was needed, administrators could seamlessly transition to the device’s 360 View, where they could access comprehensive details, review additional insights, and perform actions. This layered workflow supported quick assessments and deeper investigations while preserving context throughout the experience.
Balancing User Needs with Technical Constraints
The network visualization was built using a graph visualization library that introduced technical constraints around how nodes, edges, and interactions could be represented. I worked closely with engineers to understand these limitations and evaluate design alternatives throughout the process.
How do we create a seamless user experience while working within platform limitations?
Together, we made thoughtful trade-offs that balanced usability with technical feasibility, including simplifying node representations and adapting interactions to fit the platform’s capabilities. This collaborative approach allowed us to deliver an intuitive visualization experience without compromising the core user workflow.
Outcome
The final experience combined multi-layer visualization, hierarchical navigation, progressive topology exploration, and contextual investigation tools into a cohesive workflow that helped administrators confidently navigate complex enterprise environments.
IMPACT
The Network Visualization experience was delivered as part of Extreme Platform ONE, a unified AI-powered enterprise networking platform that enables IT administrators to monitor, troubleshoot, and manage complex network environments from a single experience.
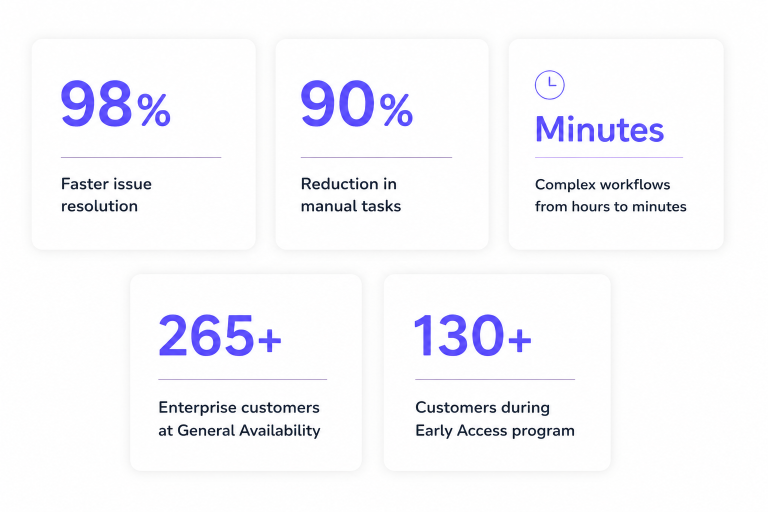
Following the public launch of Extreme Platform ONE, Extreme Networks announced significant platform outcomes:
As one of the product designers on the Network Visualization team, I designed core interaction patterns for multi-layer visualization, enterprise navigation, topology exploration, and investigation workflows that became part of the shipped Extreme Platform ONE experience.
REFLECTION
This project reinforced the type of designer I strive to be: one who transforms complex enterprise challenges into intuitive, scalable, and user-centered experiences.
Design isn't just about simplifying interfaces. It's about helping people confidently navigate complexity.
More Courses
You might also be interested in these courses
Course 2
How to build a successful email newsletter
Course 3
How to use online reviews to boost your business
Designing Interactive Network Visualization for Enterprise Infrastructure
Helping IT administrators explore, understand, and troubleshoot complex network environments through familiar navigation patterns, progressive disclosure, and clear information hierarchy.
Our Services
This text briefly introduces visitors to your main services.

Service 1
A short description of the service and how the visitor will benefit from it.

Service 2
A short description of the service and how the visitor will benefit from it.

Service 3
A short description of the service and how the visitor will benefit from it.

Service 4
A short description of the service and how the visitor will benefit from it.
benefit 1
A short description of the benefit.
benefit 2
A short description of the benefit.
benefit 3
A short description of the benefit.
benefit 4
A short description of the benefit.
Client Testimonials
© 2026 All Rights Reserved.
